

Master RCI to win extremely! Sign of mBDSR Gold XAUUSD 1-hour chart
Blacksun Indicator (List)
https://www.gogojungle.co.jp/finance/navi/articles/33779
About Blacksun free indicators and free eBooks
https://www.gogojungle.co.jp/finance/navi/articles/90181
[Reference video]
Bring the sign by using RCI for environmental recognition and multi-timeframe analysis (Part 1)
https://www.youtube.com/watch?v=1prvET_M5mA
Bring the sign by using RCI for environmental recognition and multi-timeframe analysis (Part 2)
https://www.gogojungle.co.jp/watch/1168
Bring the sign by using RCI for environmental recognition and multi-timeframe analysis (Part 3)
https://www.youtube.com/watch?v=C6DHn0lD-I4
Bring the sign by using RCI for environmental recognition and multi-timeframe analysis (Part 4)
https://www.youtube.com/watch?v=QG1iNTnLyyQ
Bring the sign by using RCI for environmental recognition and multi-timeframe analysis (Part 5)
https://www.youtube.com/watch?v=VYlGiy6Cllg
=================
[Master RCI!! Trend change, pullback buying, and bounce selling]
An indicator that shines when combined with RCI: 【BODSOR・mBDSR】
Methods and case studies (PDF) ★GogoJungle AWARD2020 Winner★
https://www.gogojungle.co.jp/tools/indicators/11836
Gold XAUUSD 1-hour chart
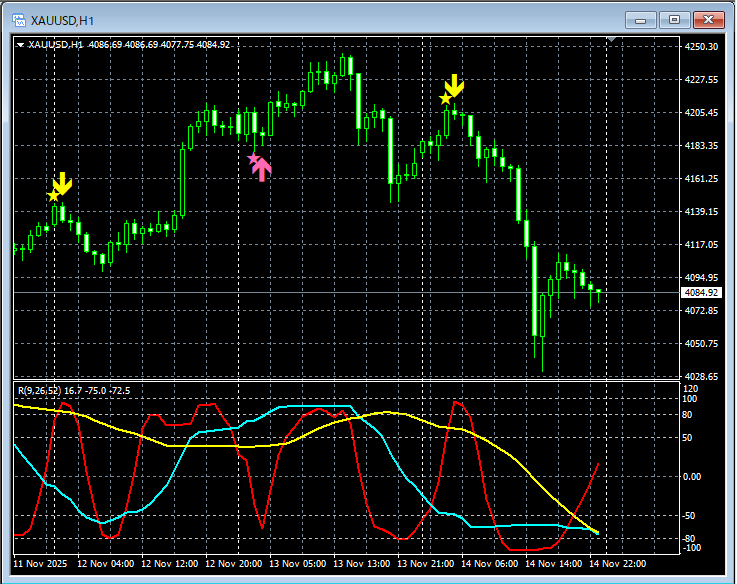
mBDSR (Dual RCI filter)Signal
In the upper chart,mBDSR (Dual RCI filter) signals light up at the right timing.
An indicator that shines when combined with RCI: 【BODSOR・mBDSR】
Methods and case studies (PDF) ★GogoJungle AWARD2020 Winner★
https://www.gogojungle.co.jp/tools/indicators/11836
More than 550 PDFs are included (Methods and case studies: over 1,950 pages, over 690,000 words).
Many of them areexamples that organize the plan to logically link higher and lower timeframes by using three RCI lines, sequentially analyzing the conditions of multiple lower timeframes, and ultimately waiting for pullbacks or bounces (i.e., mBDSR signals) on the lower timeframes..
In addition,many materials focus on identifying points where multiple entry signals overlap..
Also included is a method for exploring upside and downside targets using three RCI lines.
The PDF explanations useover 1,900 charts..

× ![]()


