

【Master RCI!!】 Double Top and mBDSR Signals USDJPY 5-minute Chart
Blacksun Indicator (List)
https://www.gogojungle.co.jp/finance/navi/articles/33779
About Blacksun's Free Indicators and Free E-books
https://www.gogojungle.co.jp/finance/navi/articles/90181
【Reference Videos】
Getting to a Signal with Environmental Recognition using RCI and Multi-Timeframe Analysis (1)
https://www.youtube.com/watch?v=1prvET_M5mA
Getting to a Signal with Environmental Recognition using RCI and Multi-Timeframe Analysis (2)
https://www.gogojungle.co.jp/watch/1168
Getting to a Signal with Environmental Recognition using RCI and Multi-Timeframe Analysis (3)
https://www.youtube.com/watch?v=C6DHn0lD-I4
Getting to a Signal with Environmental Recognition using RCI and Multi-Timeframe Analysis (4)
https://www.youtube.com/watch?v=QG1iNTnLyyQ
Getting to a Signal with Environmental Recognition using RCI and Multi-Timeframe Analysis (5)
https://www.youtube.com/watch?v=VYlGiy6Cllg
=================
【Mastering RCI!! Trend Reversals, Buy on Dips, Sell on Rallies】
Indicators that are powerful in combination with RCI【BODSOR・mBDSR】
and their methods and case studies (PDF) ★GogoJungle AWARD 2020 Winner★
https://www.gogojungle.co.jp/tools/indicators/11836
USDJPY 5-minute chart
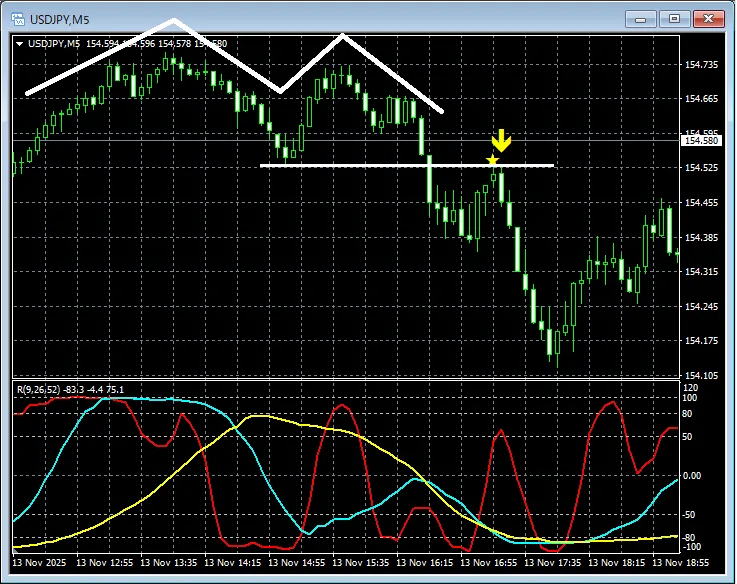
mBDSR (RCI two-filter)Signal
A decline from a double top. AndDouble top necklinenear where it pulled backmBDSR (RCI two-filter) pullback sell signallights up at the timing and it continues to fall.
Indicators that are powerful in combination with RCI【BODSOR・mBDSR】
and their methods and case studies (PDF) ★GogoJungle AWARD 2020 Winner★
https://www.gogojungle.co.jp/tools/indicators/11836
Over 550 PDFs included (Methods and Case Studies: over 1,950 pages, over 690,000 words in total).
Many of them are examples that have been distilled into a form where by using the RCI three-line setup to logically link higher and lower timeframes, you sequentially consider the conditions of multiple lower timeframes and finally wait for a dip buy or pullback sell timing (i.e., the signal of mBDSR) on the lower timeframes.
Also,there are many that focus on identifying points where multiple entry signals coincide.There are also many that explore
In addition,there are methods that look for potential upside or downside targets using three RCI lines.Also included.
In the PDF explanations,more than 1,900 chartsare used.

× ![]()


