

Crush RCI to the extremely top!! Signals for trend reversal and mBDSR AUD/JPY 15-minute chart
Blacksun Indicator (List)
https://www.gogojungle.co.jp/finance/navi/articles/33779
About Blacksun's Free Indicators and Free E-Books
https://www.gogojungle.co.jp/finance/navi/articles/90181
【Reference Video (RCI and mbdsr related)】
Bringing in the signal through environment recognition with RCI and multi-timeframe analysis (1)
https://www.youtube.com/watch?v=1prvET_M5mA
Bringing in the signal through environment recognition with RCI and multi-timeframe analysis (2)
https://www.gogojungle.co.jp/watch/1168
Bringing in the signal through environment recognition with RCI and multi-timeframe analysis (3)
https://www.youtube.com/watch?v=C6DHn0lD-I4
Bringing in the signal through environment recognition with RCI and multi-timeframe analysis (4)
https://www.youtube.com/watch?v=QG1iNTnLyyQ
Bringing in the signal through environment recognition with RCI and multi-timeframe analysis (5)
https://www.youtube.com/watch?v=VYlGiy6Cllg
=================
【Mastering RCI!! Trend Reversal, Buy on Dips, Sell on Rallies】
An indicator that shines in combination with RCI【BODSOR・mbdsr】
and techniques + case studies (PDF) ★GogoJungle AWARD2020 winner★
https://www.gogojungle.co.jp/tools/indicators/11836
AUD/JPY 15-minute chart
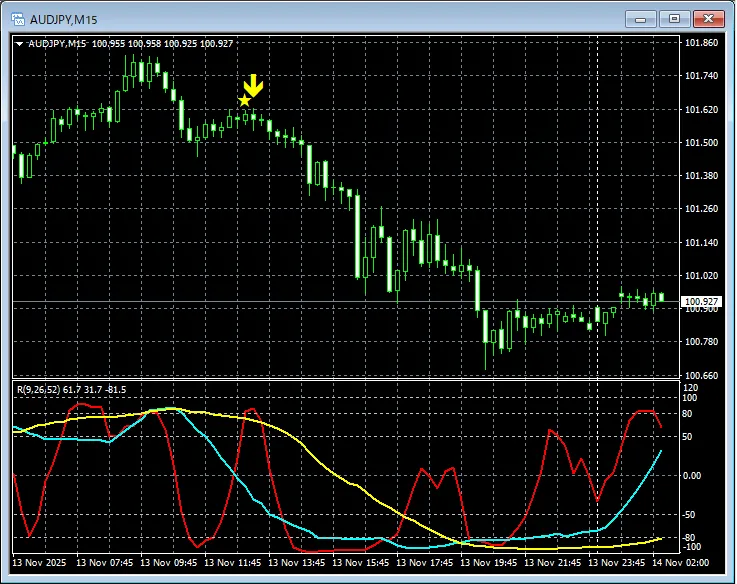
mbdsr (RCI two-filter)Signal
In the above chart, it appears to have turned down from a peak zone, andmbdsr (RCI two-filter) sell signallights up at the right timing and the price drops significantly.
An indicator that shines in combination with RCI【BODSOR・mbdsr】
and techniques + case studies (PDF) ★GogoJungle AWARD2020 winner★
https://www.gogojungle.co.jp/tools/indicators/11836
More than 550 PDF files (techniques and case studies: over 1,950 pages, over 690,000 characters in total) are included.
Many of them areexamples that lay out how to use three RCI lines to logically link higher and lower timeframes, gradually analyzing the situations of multiple lower timeframes, and ultimately waiting for dips or pullbacks on the lower timeframes (i.e., signals of mbdsr)..
Also,many focus on capturing points where multiple entry reasons coincide.
Additionally,it also includes methods for exploring upside and downside targets using three RCI lines..
In the PDF explanations,more than 1,900 chartsare used.

× ![]()


