

[Master RCI to the Extreme!!] mBDSR (RCI filter, MA filter) and the three roles of R1R2S2 utilizing distinct signals (7) USD/JPY 1-minute chart
Blacksun Indicator (List)
https://www.gogojungle.co.jp/finance/navi/articles/33779
About Blacksun's Free Indicators and Free eBooks
https://www.gogojungle.co.jp/finance/navi/articles/90181
【Reference Videos】
Bring into a form that waits for a signal with Environmental Recognition using RCI and Multi-timeframe Analysis (1)
https://www.youtube.com/watch?v=1prvET_M5mA
Environmental Recognition using RCI and Multi-timeframe Analysis to Bring into a Waiting-for-Signal Form (2)
https://www.gogojungle.co.jp/watch/1168
Environmental Recognition using RCI and Multi-timeframe Analysis to Bring into a Waiting-for-Signal Form (3)
https://www.youtube.com/watch?v=C6DHn0lD-I4
Environmental Recognition using RCI and Multi-timeframe Analysis to Bring into a Waiting-for-Signal Form (4)
https://www.youtube.com/watch?v=QG1iNTnLyyQ
Environmental Recognition using RCI and Multi-timeframe Analysis to Bring into a Waiting-for-Signal Form (5)
https://www.youtube.com/watch?v=VYlGiy6Cllg
=================
【Master RCI!! Trend Reversal, Buy on Dips, Sell on Rallies】
Indicators that pack a punch when combined with RCI【BODSOR・mBDSR】
and Method / Case Study (PDF) ★GogoJungle AWARD2020 Winner★
https://www.gogojungle.co.jp/tools/indicators/11836
【R1R2S2】 is included in the products above. For details, please see the following article in Investment Navi+.
RCI 3-line “Two-Stage Judgment” Indicator to Target Trend Reversals, Buy on Dips, and Sell on Rallies – R1R2S2 Released!!
Below we introduce examples wheremBDSR (RCI two-filter with MA two-filter)andR1R2S2signs are displayed simultaneously.
USD/JPY - 1-Minute Chart
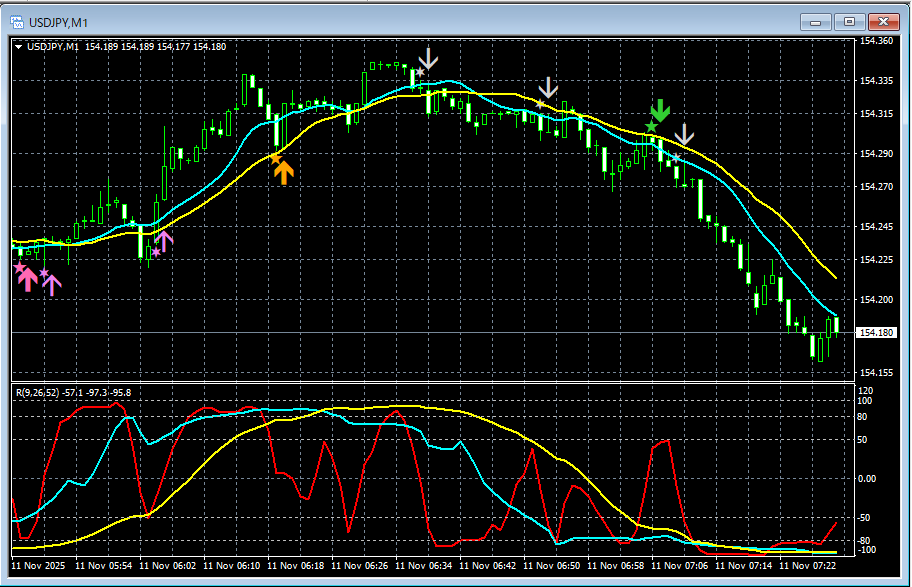
mBDSR (RCI two-filter with MA two-filter)andR1R2S2signs
In this way, mastering three signs with different roles broadens the range of situations you can respond to.
Indicators that shine in combination with RCI【BODSOR・mBDSR】
and Method / Case Study (PDF) ★GogoJungle AWARD2020 Winner★
https://www.gogojungle.co.jp/tools/indicators/11836
More than 550 PDF files (Methods & Case Studies: over 1,950 pages, over 690,000 characters) are included.
Many of them aredocuments that lay out a workflow where three RCI lines logically link higher and lower timeframes, then sequentially examine multiple lower timeframes and ultimately wait for moving-average-driven signals (i.e., mBDSR signs) on the lower timeframe for buying dips or selling ralliesas examples.
In addition,there are many that emphasize identifying points where multiple entry reasons converge.Also included are methods for exploring upside and downside targets using three-line RCI.
In the PDF explanations,
over 1,900 chartsare used.

× ![]()


