

RCI and the concerning horizontal line and pin bar and "Evening Star" and mBDSR signals USD/JPY 5-minute and 1-minute
Blacksun Indicators (List)
https://www.gogojungle.co.jp/finance/navi/articles/33779
About Blacksun Free Indicators and Free E-Books
https://www.gogojungle.co.jp/finance/navi/articles/90181
【Reference Videos】
Bringing Environment Recognition and Multi-Timeframe Analysis to the Sign-Waiting Pattern using RCI (1)
https://www.youtube.com/watch?v=1prvET_M5mA
Bringing Environment Recognition and Multi-Timeframe Analysis to the Sign-Waiting Pattern using RCI (2)
https://www.gogojungle.co.jp/watch/1168
Bringing Environment Recognition and Multi-Timeframe Analysis to the Sign-Waiting Pattern using RCI (3)
https://www.youtube.com/watch?v=C6DHn0lD-I4
Bringing Environment Recognition and Multi-Timeframe Analysis to the Sign-Waiting Pattern using RCI (4)
https://www.youtube.com/watch?v=QG1iNTnLyyQ
Bringing Environment Recognition and Multi-Timeframe Analysis to the Sign-Waiting Pattern using RCI (5)
https://www.youtube.com/watch?v=VYlGiy6Cllg
=================
【Mastering RCI!! Trend Reversal, Buy on Dips, Sell on Rallies】
Indicator that shines in combination with RCI: 【BODSOR・mBDSR】
Methods & Case Studies (PDF) ★GogoJungle AWARD2020 Winner★
https://www.gogojungle.co.jp/tools/indicators/11836
USDJPY - 5-minute Chart
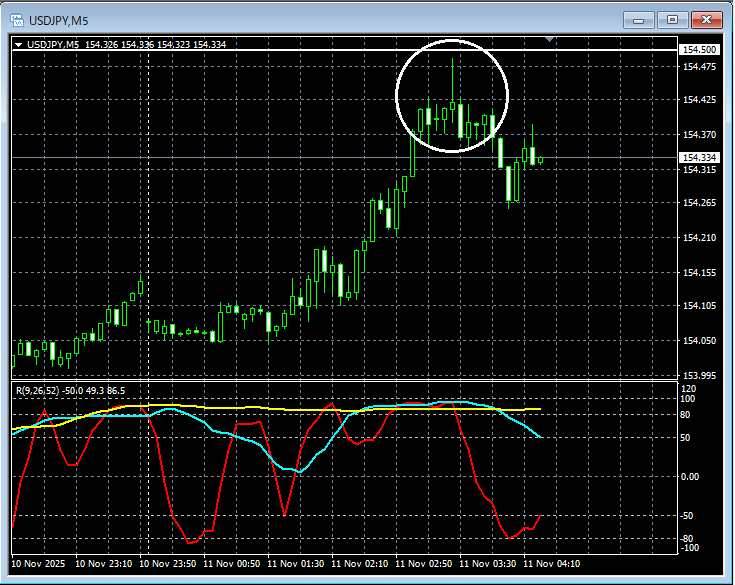
On the 5-minute chart,the notable horizontal line (154.500)is not quite reached, suggesting a downtrend reversala long upper shadow pin barappears and the price tends to fall.
USDJPY - 1-minute Chart
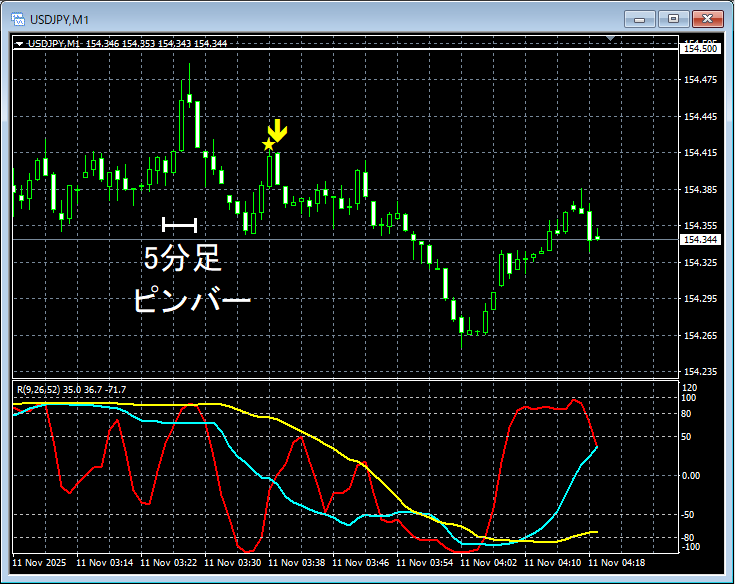
mBDSR (RCI two-filter)signal
On the 1-minute chart,the notable horizontal line (154.500)is not quite reached, suggesting a downtrend reversalEvening Star (Sakata Sangkou)candlestick pattern forming a decline. In the meantimethe mBDSR (RCI two-filter) pullback-sell signallights up at a timely moment.
Indicator that shines in combination with RCI: 【BODSOR・mBDSR】
Methods & Case Studies (PDF) ★GogoJungle AWARD2020 Winner★
https://www.gogojungle.co.jp/tools/indicators/11836
More than 550 PDFs included (Methods & Case Studies: over 1,950 pages, over 690,000 characters).
Many of these areexamples that link higher timeframes logically with lower timeframes using the three-line RCI to examine multiple lower-timeframe conditions and ultimately wait for pullbacks or sell-offs in the lower timeframes (i.e., the mBDSR signal)..
Additionally,many focus on capturing points where multiple entry reasons overlap..
Also included is a method for exploring upside and downside targets using three-line RCI.
In the PDF explanations,more than 1,900 chartsare used.

× ![]()


