

【RCIを極めて勝つ!!】Roll reversal and mBDSR signal EUR/JPY 15-minute chart
BlackSun Indicators (List)
https://www.gogojungle.co.jp/finance/navi/articles/33779
About BlackSun's Free Indicators and Free E-Books
https://www.gogojungle.co.jp/finance/navi/articles/90181
【Reference Videos】
Bringing it to the point where you wait for a signal with environment recognition and multi-timeframe analysis using RCI (1)
https://www.youtube.com/watch?v=1prvET_M5mA
Bringing it to the point where you wait for a signal with environment recognition and multi-timeframe analysis using RCI (2)
https://www.gogojungle.co.jp/watch/1168
Bringing it to the point where you wait for a signal with environment recognition and multi-timeframe analysis using RCI (3)
https://www.youtube.com/watch?v=C6DHn0lD-I4
Bringing it to the point where you wait for a signal with environment recognition and multi-timeframe analysis using RCI (4)
https://www.youtube.com/watch?v=QG1iNTnLyyQ
Bringing it to the point where you wait for a signal with environment recognition and multi-timeframe analysis using RCI (5)
https://www.youtube.com/watch?v=VYlGiy6Cllg
=================
【Mastering RCI!! Trend Reversal · Buy on Dips · Sell on Rallies】
An indicator that shines when combined with RCI【BODSOR・mBDSR】
and methods · case studies (PDF) ★Winner of GogoJungle AWARD 2020★
https://www.gogojungle.co.jp/tools/indicators/11836
EURJPY 15-minute chart
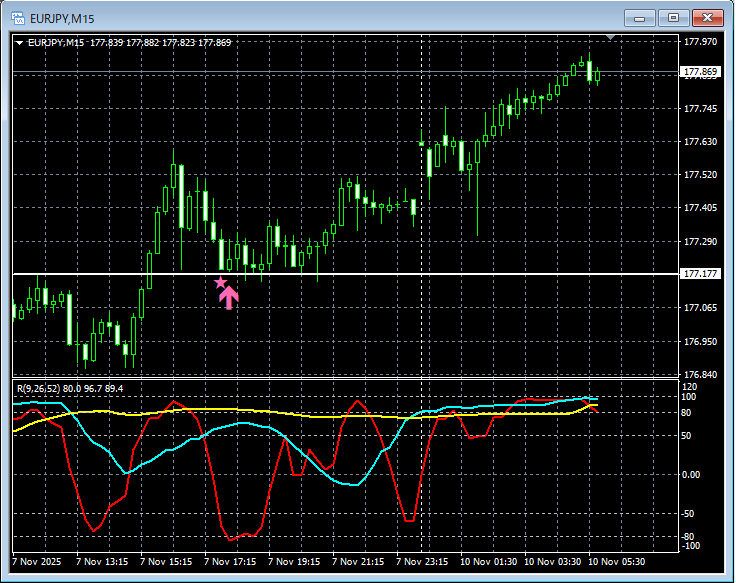
mBDSR (RCI two-line filter)Signal
In the chart above, it drops to near the line that was briefly brokenmBDSR (RCI two-line filter) dip-buy signallights up at the right timing(Roll Reversal).
An indicator that shines when combined with RCI【BODSOR・mBDSR】
and methods · case studies (PDF) ★Winner of GogoJungle AWARD 2020★
https://www.gogojungle.co.jp/tools/indicators/11836
Over 550 PDF files (methods · case studies: totaling over 1,950 pages, over 690,000 words) are included.
Most of them aresummaries of examples that use three RCI lines to logically link higher and lower timeframes, progressively analyzing the situations of multiple lower timeframes, and ultimately waiting for dip-buying or pullback selling timing (i.e., mBDSR signals) on the lower timeframes..
Also,many focus on capturing points where multiple entry reasons overlap..
In addition,it also includes methods for exploring upward and downward targets using three RCI lines..
In the PDF explanations,more than 1,900 chartsare used.

× ![]()


