

[Important: A rebound attempt at the daily level] RCI three-line signal, important moving averages, and mBDSR signals Euro-Dollar 1-hour chart
Blacksun Indicator (List)
https://www.gogojungle.co.jp/finance/navi/articles/33779
Blacksun Free Indicators and Free E-Books
https://www.gogojungle.co.jp/finance/navi/articles/90181
【Reference Videos (RCI and mBDSR related)】
Bring the signals to the waiting stage with environment recognition using RCI and multi-timeframe analysis (1)
https://www.youtube.com/watch?v=1prvET_M5mA
Bring the signals to the waiting stage with environment recognition using RCI and multi-timeframe analysis (2)
https://www.gogojungle.co.jp/watch/1168
Bring the signals to the waiting stage with environment recognition using RCI and multi-timeframe analysis (3)
https://www.youtube.com/watch?v=C6DHn0lD-I4
Bring the signals to the waiting stage with environment recognition using RCI and multi-timeframe analysis (4)
https://www.youtube.com/watch?v=QG1iNTnLyyQ
Bring the signals to the waiting stage with environment recognition using RCI and multi-timeframe analysis (5)
https://www.youtube.com/watch?v=VYlGiy6Cllg
=================
【Mastering RCI!! Trend Reversal, Buy on Dips, Sell on Rallies】
An indicator that shines in combination with RCI: BODSOR and mBDSR
Methods and Case Studies (PDF) ★GogoJungle AWARD 2020 winner★
https://www.gogojungle.co.jp/tools/indicators/11836
EURUSD Daily
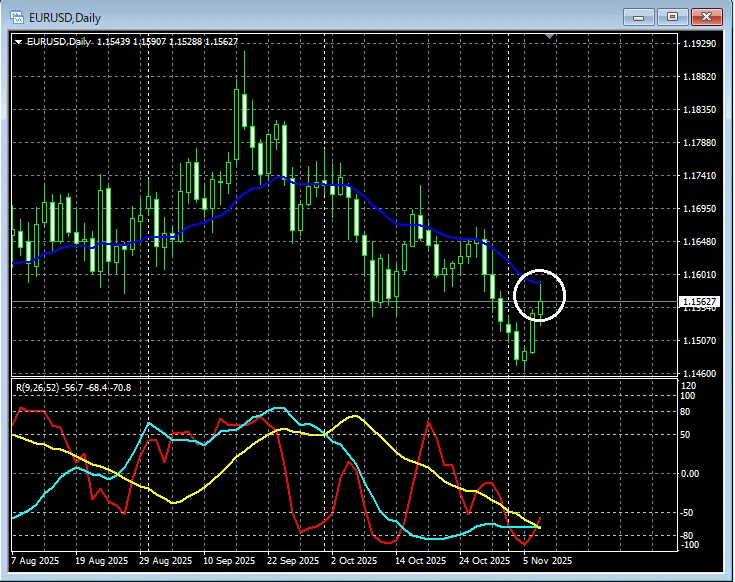
On the daily chart, a retracement is being attempted. Around the area enclosed by the white circle (near the Daily EMA21 point), we will look at this on lower timeframes.
EURUSD 5-minute chart
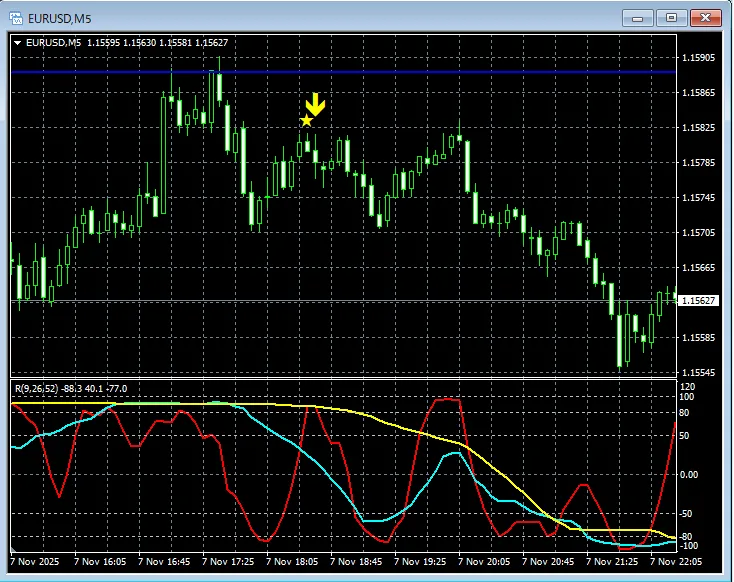
mBDSR (RCI two-line filter) signal
In the upper chart,near the Daily EMA21 the price seems to be reversing.mBDSR (RCI two-line filter) retracement sell signal lights up at the right timing and pushes down.
An indicator that shines in combination with RCI【BODSOR・mBDSR】
Methods and Case Studies (PDF) ★GogoJungle AWARD 2020 winner★
https://www.gogojungle.co.jp/tools/indicators/11836
More than 550 PDF files (Methods and Case Studies: over 1,950 pages, over 690,000 characters in total) are included.
Many of them are designed to logically link higher and lower timeframes using three RCI lines, sequentially examining multiple lower-timeframe conditions, and ultimately forming a setup that waits for a dip-buy or pullback-sell timing on the lower timeframes (the signal of mBDSR).
Additionally,there are many that emphasize identifying points where multiple entry reasons overlap.Also included is a method to explore upside and downside targets using three RCI lines.
In the PDF explanations,
over 1,900 charts are used.

× ![]()


