

[Master RCI to Victory!!] Targeting the rebound after a new low with the mBDSR signal NZDCAD 15-minute chart
Blacksun Indicator (List)
https://www.gogojungle.co.jp/finance/navi/articles/33779
Information on Blacksun's free indicators and free e-books
https://www.gogojungle.co.jp/finance/navi/articles/90181
【Reference Video】
Bringing the environment recognition and multi-timeframe analysis using RCI to the point of waiting for a signal (1)
https://www.youtube.com/watch?v=1prvET_M5mA
Bringing the environment recognition and multi-timeframe analysis using RCI to the point of waiting for a signal (2)
https://www.gogojungle.co.jp/watch/1168
=================
【Mastering RCI!! Trend Reversal, Buy on Dips, Sell on Rallies】
Indicators that shine when used in combination with RCI【BODSOR・mBDSR】
Methods and Case Studies (PDF) ★GogoJungle AWARD2020 winner★
https://www.gogojungle.co.jp/tools/indicators/11836
NZDCAD 15-minute chart
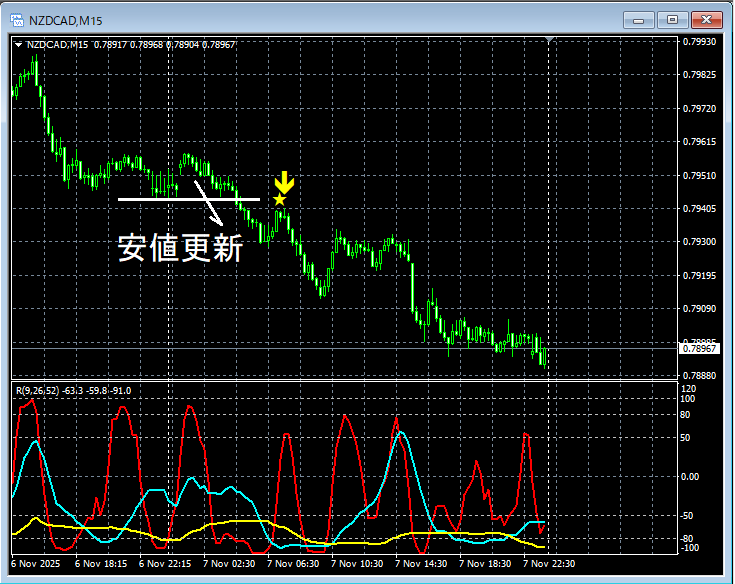
mBDSR (RCI two-line filter)signal
On the chart above,lower low being madeduring the pullback after a declinemBDSR (RCI two-line filter) sell signal on pullbacklights up at the right timing.
Indicators that shine when used in combination with RCI【BODSOR・mBDSR】
Methods and Case Studies (PDF) ★GogoJungle AWARD2020 winner★
https://www.gogojungle.co.jp/tools/indicators/11836
More than 550 PDF files (Methods & Case Studies: over 1,950 pages, over 690,000 characters) are included.
Many of them are designed todocument examples that link higher and lower timeframes logically using three RCI lines, examining multiple lower-timeframes step by step, and ultimately waiting for a dip-buy or pullback timing (i.e., mBDSR signals) on the lower timeframe.as described.
Additionally,there are many that focus on capturing points where multiple entry reasons align.as well.
Furthermore,it also includes methods for exploring potential upside and downside targets using three-line RCI..
In the PDF descriptions,over 1,900 chartsare used.

× ![]()


