

Seasoned and battle-hardened [Mastering RCI to win!!] Sign of R1R2S2 Dollar/Swiss 1-hour chart
Blacksun Indicator (List)
https://www.gogojungle.co.jp/finance/navi/articles/33779
About Blacksun’s Free Indicators and Free E-books
https://www.gogojungle.co.jp/finance/navi/articles/90181
[Reference Video]
Carrying out environment recognition with RCI and multi-timeframe analysis to reach a state where you wait for a signal (1)
https://www.youtube.com/watch?v=1prvET_M5mA
Carrying out environment recognition with RCI and multi-timeframe analysis to reach a state where you wait for a signal (2)
https://www.gogojungle.co.jp/watch/1168
=================
[Master RCI!! Trend Reversal, Buy on Dips, Sell on Rallies]
Indicators that excel in combination with RCI: [BODSOR, mBDSR]
and Methods / Case Studies (PDF) ★GogoJungle AWARD2020 winner★
https://www.gogojungle.co.jp/tools/indicators/11836
R1R2S2is included in the above product. For details, please read the Investment Navi+ article below.
Launch of the indicator “R1R2S2” that uses 3 RCI lines to target trend reversal, buy on dips, and sell on rallies with a two-stage判断 (two-stage decision)!
※In addition to the above PDF, the product【BODSOR・mBDSR】includes 31 PDFs (Methods & Case Studies: over 120 pages, over 115 charts, over 40,000 words) to effectively utilize R1R2S2.
PDF Collection to Effectively Use R1R2S2【Master RCI to Win!!】
https://www.gogojungle.co.jp/finance/navi/articles/93154
Please refer to the Invest Navi+ article above for the file names and titles of the PDFs to effectively use R1R2S2.
Below, we introduce examples of signals forR1R2S2.
USD/CHF – US Dollar against Swiss Franc – 1-hour chart
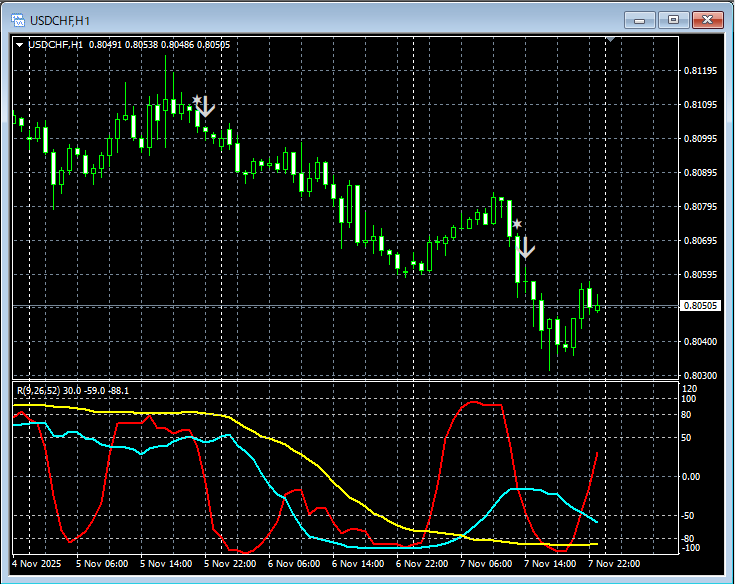
R1R2S2Signal
In the chart above, the signal ofR1R2S2lights up in time.
Waiting for the signal from mBDSR,but if the mBDSR signaldoes not light up, or you miss or are late to see it,R1R2S2 signalscan respond,R1R2S2isoften used in conjunction withmBDSR.
Indicators that shine when combined with RCI【BODSOR・mBDSR】
and Methods / Case Studies (PDF) ★GogoJungle AWARD2020 winner★
https://www.gogojungle.co.jp/tools/indicators/11836
More than 550 PDF files (Methods & Case Studies: over 1,950 pages, over 690,000 words) are included.
Many of these are examples where you logically link higher and lower timeframes using three RCI lines to sequentially analyze multiple lower timeframes, ultimately waiting for a dips buy or rallies sell timing on the lower timeframes (i.e., the signal of mBDSR).
Also,there are many that focus on capturing points where multiple entry reasons overlap..
In addition,the method to explore upward and downward targets using three RCI linesis included.
In the PDF descriptions,over 1,900 chartsare used.


