

Australian dollar vs New Zealand dollar rising trend and mBDSR pullback buying signal [Master RCI to win!!]
Blacksun Indicators (List)
https://www.gogojungle.co.jp/finance/navi/articles/33779
About Blacksun Free Indicators and Free E-Books
https://www.gogojungle.co.jp/finance/navi/articles/90181
【Reference Video】
Environment recognition using RCI and multi-timeframe analysis to bring it to a form that waits for a signal (1)
https://www.youtube.com/watch?v=1prvET_M5mA
Environment recognition using RCI and multi-timeframe analysis to bring it to a form that waits for a signal (2)
https://www.gogojungle.co.jp/watch/1168
=================
【Mastering RCI!! Trend Reversal, Buy on Dips, and Buy the Retracements】
An indicator that shines in combination with RCI: 【BODSOR・mBDSR】
and Techniques / Case Studies (PDF) ★GogoJungle AWARD2020 Winner★
https://www.gogojungle.co.jp/tools/indicators/11836
※This product【BODSOR・mBDSR】includes over 550 PDFs (Total over 1,950 pages, over 1,900 chart images, and over 690,000 characters) as part of the methods and case studies.
mBDSR (RCI Filter)andmBDSR (Moving Average Filter)have different roles. The accompanying PDF also discusses how to use them.
mBDSR (Moving Average Filter)For the PDF file name and title that contain explanations, please see the article below in Investment Navi+.
【Master RCI and Win!!】Summary of PDFs Explaining mBDSR (Moving Average Filter)
https://www.gogojungle.co.jp/finance/navi/articles/90127
Below, we 소개 the signals formBDSR (Moving Average Filter)signals.
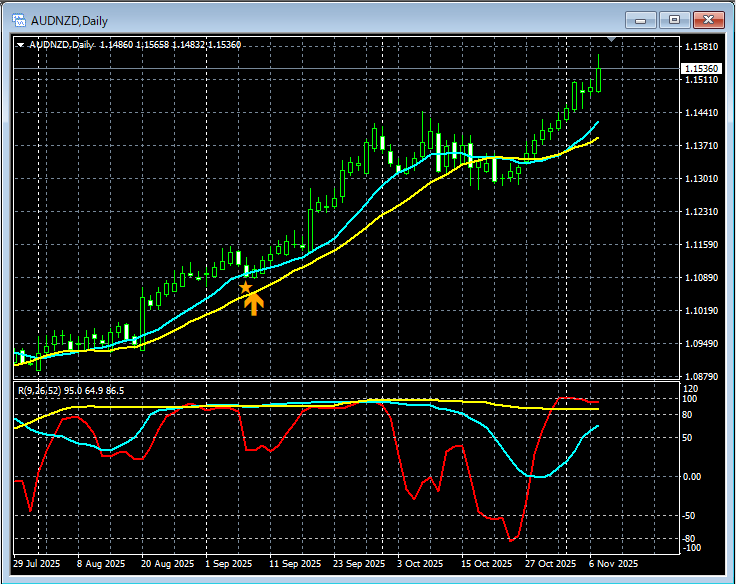
AUDUSD – Australian Dollar / New Zealand Dollar Daily
AUDUSD – Australian Dollar / New Zealand Dollar 4-hour
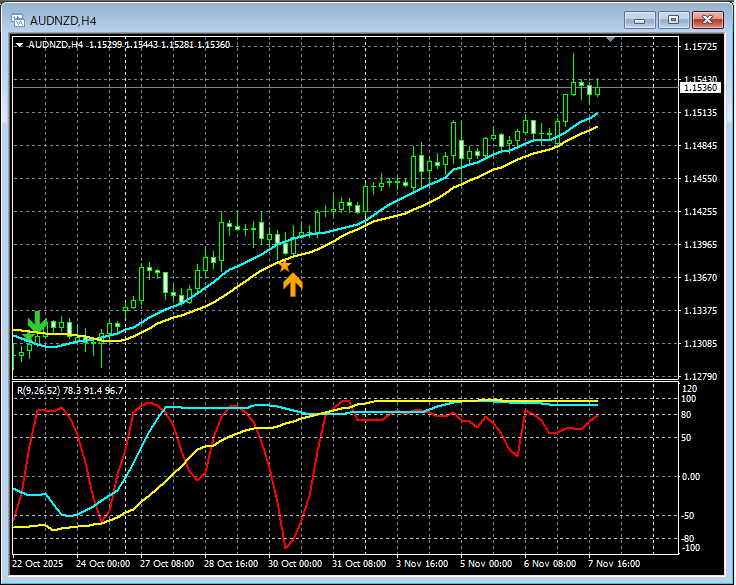
In the above chart,the mBDSR (Moving Average Filter) signallights up at an opportune timing.
Even for the Moving Average Filter mBDSR,When used in conjunction with RCI's three lines to map from higher to lower timeframes, trades with a high edge become possible. This is also explained in thePDFthat comes with it.
※ Please note that some charts in this article may have added circles, lines, or rectangles for explanation purposes.
Indicator that shines in combination with RCI【BODSOR・mBDSR】
and its methods / case studies (PDF) ★GogoJungle AWARD2020 Winner★
https://www.gogojungle.co.jp/tools/indicators/11836
Over 550 PDF files (Methods / Case Studies: Total over 1,950 pages, over 690,000 characters) are included.
Most of them areexamples that logically link higher and lower timeframes using three RCI lines, then examine multiple lower-timeframe conditions one by one, ultimately waiting for the dip buy or retrace sell timing on the lower timeframe (i.e., the mBDSR signal)..
Additionally,many focus on capturing points where multiple entry reasons overlap..
Furthermore,the method of exploring upside and downside targets using three-line RCI is also included..
In the PDF explanations,over 1,900 charts are used..


