

Battle-hardened【Mastering RCI to win!!】Moving averages, head and shoulders, and mBDSR signals NZDCAD 1-hour chart
Blacksun Indicator (List)
https://www.gogojungle.co.jp/finance/navi/articles/33779
About Blacksun Free Indicators and Free E-Books
https://www.gogojungle.co.jp/finance/navi/articles/90181
【Reference video (RCI and mBDSR related)】
Bring the environment recognition using RCI and multi-timeframe analysis to the point of waiting for a signal (1)
https://www.youtube.com/watch?v=1prvET_M5mA
Bring the environment recognition using RCI and multi-timeframe analysis to the point of waiting for a signal (2)
https://www.gogojungle.co.jp/watch/1168
Bring the environment recognition using RCI and multi-timeframe analysis to the point of waiting for a signal (3)
https://www.youtube.com/watch?v=C6DHn0lD-I4
Bring the environment recognition using RCI and multi-timeframe analysis to the point of waiting for a signal (4)
https://www.youtube.com/watch?v=QG1iNTnLyyQ
Bring the environment recognition using RCI and multi-timeframe analysis to the point of waiting for a signal (5)
https://www.youtube.com/watch?v=VYlGiy6Cllg
=================
【Mastering RCI!! Trend Reversal, Buy on Dips, Sell on Rallies】
An indicator that shines when combined with RCI【BODSOR・mBDSR】
and methods and case studies (PDF) ★GogoJungle AWARD2020 winner★
https://www.gogojungle.co.jp/tools/indicators/11836
NZDCAD 1-hour chart
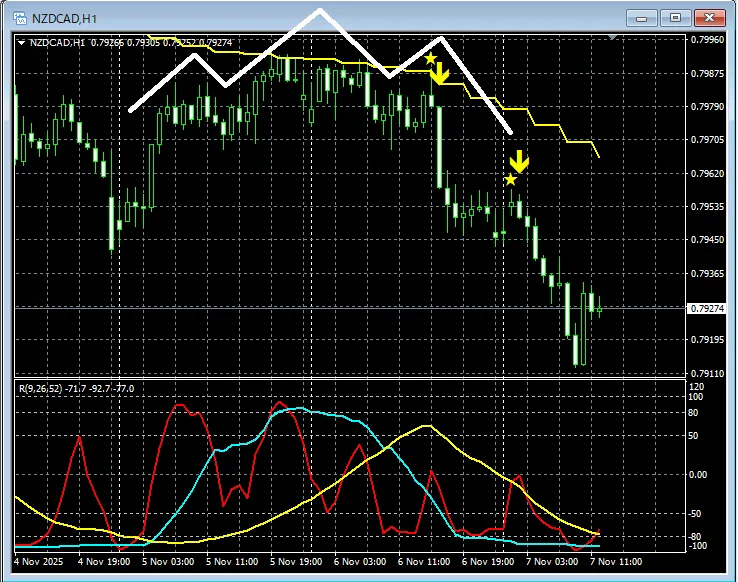
mBDSR (RCI two-filter)Signal
In the chart above,the moving average being watched (in this case the 4-hour EMA21)is near theShoulders of the Head and Shoulderspattern forming and moving down.Right shoulder of the Head and Shouldersand the subsequent retracementthe mBDSR (two-filter RCI) pullback sell signallights up at a timely moment.
An indicator that shines when combined with RCI【BODSOR・mBDSR】
and methods and case studies (PDF) ★GogoJungle AWARD2020 winner★
https://www.gogojungle.co.jp/tools/indicators/11836
More than 550 PDF files (Methods and case studies: over 1,950 pages, over 690,000 characters in total) are included.
Most of them aresummaries of examples that link higher-timeframe and lower-timeframe logically using three RCI lines, examining multiple lower-timeframe conditions in sequence, and ultimately waiting for pullbacks or rally timing (the signs of mBDSR) on the lower timeframes.
Also,many emphasize identifying points where multiple entry reasons coincide.
Additionally,there are methods that explore upside and downside targets using three RCI linesas well.
In the PDF explanations,more than 1,900 chartsare used.

× ![]()


