

Battle-hardened【Mastering RCI to beat it with a moving average filter!!】USD/JPY 15-minute chart mBDSR pullback selling signal
【RCI Related】 Blacksun's Free Indicator and Free E-book
https://www.gogojungle.co.jp/finance/navi/articles/90181
【Reference Video】
Environment recognition using RCI and multi-timeframe analysis to bring it to a form waiting for a signal (1)
https://www.youtube.com/watch?v=1prvET_M5mA
Environment recognition using RCI and multi-timeframe analysis to bring it to a form waiting for a signal (2)
https://www.gogojungle.co.jp/watch/1168
==============================
【Master RCI!! Trend Reversal, Buy on Dips, Sell on Rallies】
Indicator that shines in combination with RCI【BODSOR・mBDSR】
and Methods / Case Studies (PDF) ★GogoJungle AWARD2020 Winner★
https://www.gogojungle.co.jp/tools/indicators/11836
※This product【BODSOR・mBDSR】includes more than 550 PDFs as methods and case studies (totaling over 1,950 pages, over 1,900 charts, and over 690,000 characters).
mBDSR (RCI Filter)andmBDSR (Moving Average Filter)have different roles. The usage distinctions are also covered in the included PDFs.
mBDSR (Moving Average Filter)For a PDF with explanations about this, please see the following Investment Navi+ article for file name and title.
【Master RCI!!】 Summary of PDFs with explanations about mBDSR (Moving Average Filter)
https://www.gogojungle.co.jp/finance/navi/articles/90127
Below,mBDSR (Moving Average Filter)signal examples will be introduced.
USD/JPY 15-minute chart
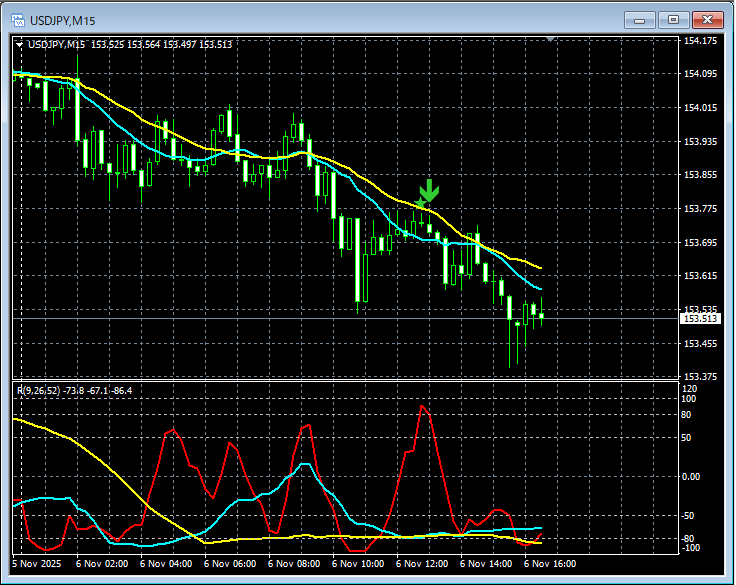
In the chart above,the sell-on-rally signal of mBDSR (moving average filter) lights up at the right timing..
In the case of the Moving Average Filter mBDSRalsowhen used in conjunction with a top-down approach using the three RCI lines from higher to lower timeframes, it enables higher-probability trades. This is also explained in the included PDF.※ Please note that some charts shown in this article may have been annotated with circles, lines, and rectangles for explanatory convenience.In combination with RCI, the indicator【BODSOR・mBDSR】 shinesand its methods / case studies (PDF) ★GogoJungle AWARD2020 Winner★https://www.gogojungle.co.jp/tools/indicators/11836Includes more than 550 PDF files (methods and case studies: totaling over 1,950 pages and over 690,000 characters).Most of them areexamples that link multiple higher and lower timeframes logically using the three RCI lines, and finally lay out the pattern of waiting for a dip buy or rally sell on the lower timeframe as a BDSR signal..Additionally,there are many that focus on identifying points where multiple entry reasons converge..Also included is a method for searching upside and downside targets using the three RCI lines.In the PDF explanations,more than 1,900 charts are used..==============================Blacksun's Indicators (List)https://www.gogojungle.co.jp/finance/navi/articles/33779==============================
※ Please note that some charts shown in this article may have been annotated with circles, lines, and rectangles for explanatory convenience.
In combination with RCI, the indicator【BODSOR・mBDSR】 shines
and its methods / case studies (PDF) ★GogoJungle AWARD2020 Winner★
https://www.gogojungle.co.jp/tools/indicators/11836
Includes more than 550 PDF files (methods and case studies: totaling over 1,950 pages and over 690,000 characters).
Most of them areexamples that link multiple higher and lower timeframes logically using the three RCI lines, and finally lay out the pattern of waiting for a dip buy or rally sell on the lower timeframe as a BDSR signal..
Additionally,there are many that focus on identifying points where multiple entry reasons converge..
Also included is a method for searching upside and downside targets using the three RCI lines.
In the PDF explanations,more than 1,900 charts are used..

==============================
Blacksun's Indicators (List)
https://www.gogojungle.co.jp/finance/navi/articles/33779
==============================


