

Battle-hardened [Mastering RCI to win with moving average filter!!] AUDJPY 30-minute chart mBDSR return-sell signal
Blacksun Indicator (List)
https://www.gogojungle.co.jp/finance/navi/articles/33779
Blacksun Free Indicators and Free E-books
https://www.gogojungle.co.jp/finance/navi/articles/90181
【Reference Video】
Environment recognition with RCI and multi-timeframe analysis to bring it to the point of waiting for a signal (Part 1)
https://www.youtube.com/watch?v=1prvET_M5mA
Environment recognition with RCI and multi-timeframe analysis to bring it to the point of waiting for a signal (Part 2)
https://www.gogojungle.co.jp/watch/1168
Environment recognition with RCI and multi-timeframe analysis to bring it to the point of waiting for a signal (Part 3)
https://www.youtube.com/watch?v=C6DHn0lD-I4
Environment recognition with RCI and multi-timeframe analysis to bring it to the point of waiting for a signal (Part 4)
https://www.youtube.com/watch?v=QG1iNTnLyyQ
Environment recognition with RCI and multi-timeframe analysis to bring it to the point of waiting for a signal (Part 5)
https://www.youtube.com/watch?v=VYlGiy6Cllg
=================
【Mastering RCI!! Trend Reversal, Buy the Dip, Sell the Rally】
Indicator that shines in combination with RCI【BODSOR・mBDSR】
and Techniques / Case Studies (PDF) ★GogoJungle AWARD 2020 Winner★
https://www.gogojungle.co.jp/tools/indicators/11836
※This product【BODSOR・mBDSR】includes more than 550 PDFs as methods and case studies (totaling over 1,950 pages, over 1,900 chart images, and over 690,000 words).
mBDSR (RCI Filter)andmBDSR (Moving Average Filter)have different roles. The accompanying PDFs also discuss how to use them distinctly.
mBDSR (Moving Average Filter)For the filename and title of the PDF that explains it, please see the following Investment Navi+ article.
【Master RCI!!】Summary of PDFs that explain mBDSR (Moving Average Filter)
https://www.gogojungle.co.jp/finance/navi/articles/90127
Below, we introduce examples of signals formBDSR (Moving Average Filter).
AUD/USD 30-minute
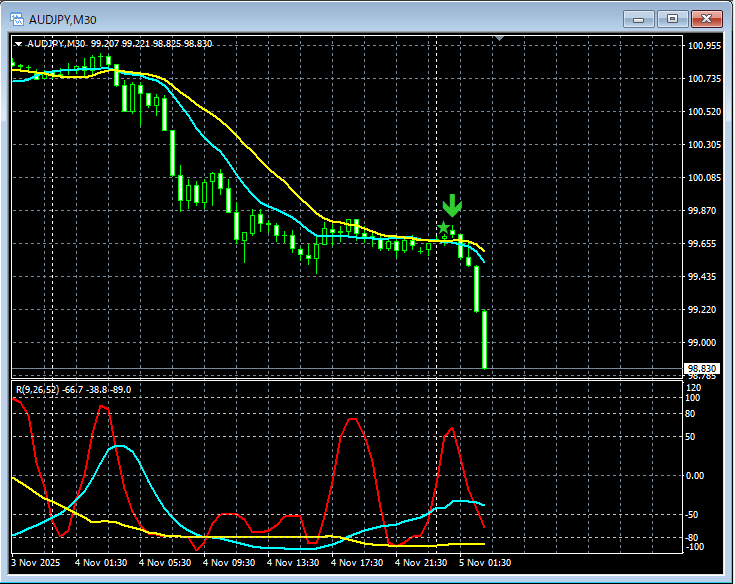
In the above chart,the sell signal of the mBDSR (Moving Average Filter) is lighting up at a timely moment.
In the case of the Moving Average Filter mBDSRas well,when combined with the drop-through from higher timeframes to lower timeframes using three RCI linesit enables higher-probability trades. This is also explained in the attached PDF.
※ Please note that in the charts shown in this article, for clarity of explanation, circles, lines, and boxes may be drawn.
The powerful combination with RCI: Indicator【BODSOR・mBDSR】
and Techniques / Case Studies (PDF) ★GogoJungle AWARD 2020★
https://www.gogojungle.co.jp/tools/indicators/11836
Includes more than 550 PDF files (Methods and Case Studies: over 1,950 pages, over 690,000 characters).
Most of them are gathered as examples where the higher and lower timeframes are logically linked using three RCI lines, sequentially considering multiple lower timeframes, and ultimately waiting for pullbacks/buys or pullbacks/sells on the lower timeframes (the signals of mBDSR).
Also,many of them focus on identifying points where multiple entry reasons coincide.There are many cases included.
Additionally,there are methods that explore upside and downside targets using three RCI lines.These are included as well.
In the PDF explanations,more than 1,900 chartsare used.


