

Battle-hardened【Mastering RCI to win!!】Sign of R1R2S2 USD/JPY 30-minute chart
Blacksun Indicator (List)
https://www.gogojungle.co.jp/finance/navi/articles/33779
About Blacksun Free Indicators and Free E-Books
https://www.gogojungle.co.jp/finance/navi/articles/90181
[Reference Video]
Using RCI for environmental recognition and multi-timeframe analysis to reach the point of waiting for a signal (1)
https://www.youtube.com/watch?v=1prvET_M5mA
Using RCI for environmental recognition and multi-timeframe analysis to reach the point of waiting for a signal (2)
https://www.gogojungle.co.jp/watch/1168
=================
[Mastering RCI!! Trend Reversal, Buy on Dips, Sell on Retracements]
An indicator that shines in combination with RCI: [BODSOR, mBDSR]
Methods and case studies (PDF) ★Winner of GogoJungle AWARD 2020★
https://www.gogojungle.co.jp/tools/indicators/11836
R1R2S2is included in the above products. For details, please read the Investment Navi+ article below.
RCI with three lines ‘Two-step determination’ to target trend reversal, buying dips, and selling retracements — R1R2S2 released!!
*In addition to the PDF above, the BODSOR and mBDSR products include 31 more PDFs (Methods & Case Studies: over 120 pages, over 115 charts, over 40,000 words).
PDF Collection for Using R1R2S2 Effectively [Master RCI to Win!!]
https://www.gogojungle.co.jp/finance/navi/articles/93154
For the file names and titles of the PDFs to effectively use R1R2S2, please refer to the above Investment Navi+ article.
Below, we will 소개 the examples of signals forR1R2S2.
Dollar/Yen USDJPY 30-minute chart
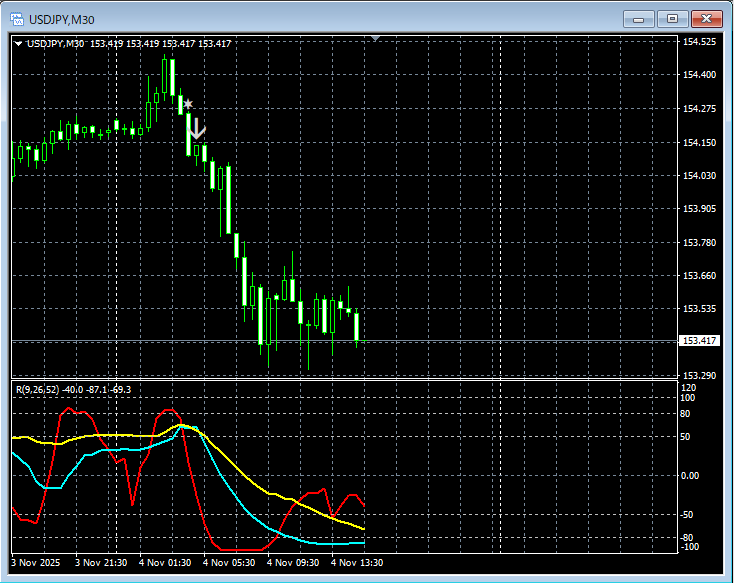
R1R2S2Signals
In the chart above,R1R2S2 signalslight up at timely moments.
MBD SR signalsare being waited for,MBD SR signalsdid not light up, or if you missed the signal or were late,R1R2S2 signalsmay be used to respond, andR1R2S2is often used together withMBD SR.
An indicator that shines in combination with RCI: [BODSOR, mBDSR]
Methods and case studies (PDF) ★Winner of GogoJungle AWARD 2020★
https://www.gogojungle.co.jp/tools/indicators/11836
Includes over 550 PDF files (Methods & Case Studies: over 1,950 pages, over 690,000 words) attached.
Many of them areexamples that logically link higher time frames with lower time frames using three RCI lines, then break them down to waiting for dip buys or retracements (i.e., MBD SR signals) on the lower time frame.
Additionally,many focus on capturing points where multiple entry reasons overlap.
Also included are methods for exploring upside and downside targets using three RCI lines.
The explanation in the PDF files usesover 1,900 charts.


