

Seasoned Warrior [Mastering RCI to Win!!] Sign of R1R2S2 Dow Jones Industrial Average US30 15-minute chart
Blacksun Indicators (List)
https://www.gogojungle.co.jp/finance/navi/articles/33779
About Blacksun’s Free Indicators and Free E-Books
https://www.gogojungle.co.jp/finance/navi/articles/90181
[Reference Video]
Environment recognition using RCI and multi-timeframe analysis to bring it to the form ready to wait for a signal (1)
https://www.youtube.com/watch?v=1prvET_M5mA
Environment recognition using RCI and multi-timeframe analysis to bring it to the form ready to wait for a signal (2)
https://www.gogojungle.co.jp/watch/1168
=================
[Master RCI!! Trend Reversal, Buy on Dips, and Sell on Rallies]
Indicators that excel in combination with RCI: 【BODSOR・mBDSR】
and Methods & Case Studies (PDF) ★2020 GogoJungle AWARD★
https://www.gogojungle.co.jp/tools/indicators/11836
R1R2S2is included in the above product. For details, please read the Investment Navi+ article below.
RCI3 signals 'two-step confirmation' to target trend reversal, buy on dips, and sell on rallies – R1R2S2 released!!
※This product 【BODSOR・mBDSR】 includes, in addition to the traditional PDFs (358 PDFs totaling over 1,400 pages, over 1,350 chart pages, over 470,000 words).
※In addition to the above PDFs, there are 31 PDFs (methods & case studies: over 120 pages, over 115 charts, over 40,000 words) to effectively utilize R1R2S2.
PDF Collection for Effective Use of R1R2S2 [Master RCI to Win!!]
https://www.gogojungle.co.jp/finance/navi/articles/93154
Please refer to the Investment Navi+ article above for the file names and titles of the PDFs to effectively utilize R1R2S2.
Below, we introduce examples of signals forR1R2S2.
Dow Jones Average US30 15-minute chart
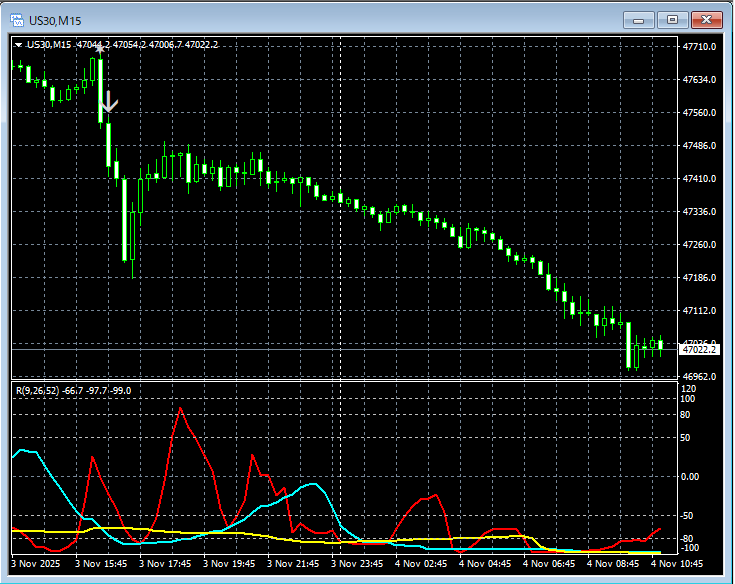
R1R2S2signals
In the chart above,R1R2S2 signalslight up at timely moments.
Wait for mBDSR signals,mBDSR signals did not illuminate or were missed or delayed,R1R2S2 signalscan be used to respond.R1R2S2isoften used together withmBDSR.
Indicators that excel in combination with RCI【BODSOR・mBDSR】
and Methods & Case Studies (PDF) ★GogoJungle AWARD2020★
https://www.gogojungle.co.jp/tools/indicators/11836
Over 550 PDFs included (Methods & Case Studies: totaling over 1,950 pages, over 690,000 words).
Many of these are aboutusing the three RCI lines to logically link higher and lower timeframes, sequentially analyzing multiple lower-timeframe conditions, and ultimately waiting for a dip-buy or rally-sell timing on the lower timeframe (the mBDSR signal)..
In addition,many focus on capturing points where multiple entry reasons overlap..
Also included is a method to explore upside and downside targets using three RCI lines.
In the PDF explanations,over 1,900 charts are used.


