

Battle-hardened【Mastering RCI to win!!】Sign of R1R2S2 Dow Jones Industrial Average US30 30-minute chart
Blacksun Indicator (List)
https://www.gogojungle.co.jp/finance/navi/articles/33779
About Blacksun's Free Indicators and Free E-Books
https://www.gogojungle.co.jp/finance/navi/articles/90181
【Reference Video】
Bring the sign to the formation by using RCI with environmental recognition and multi-time-frame analysis (Part 1)
https://www.youtube.com/watch?v=1prvET_M5mA
Bring the sign to the formation by using RCI with environmental recognition and multi-time-frame analysis (Part 2)
https://www.gogojungle.co.jp/watch/1168
=================
【Master RCI!! Trend Reversal, Buy the Dips, and Sell the Rallies】
An indicator that shines in combination with RCI【BODSOR・mBDSR】
and methods / case studies (PDF) ★GogoJungle AWARD2020 winner★
https://www.gogojungle.co.jp/tools/indicators/11836
R1R2S2is included in the above product. For details, please read the following Investment Navi+ articles.
RCI 3 lines '2-stage judgment' to capture trend reversals, dips, and rallies — R1R2S2 released!!
※This product【BODSOR・mBDSR】includes, in addition to the above PDF, 358 PDFs (total over 1,400 pages, over 1,350 chart pages, over 470,000 words) as methods and case studies.
※Separately from the above PDFs, 31 PDFs (methods & case studies: over 120 pages, over 115 chart pages, over 40,000 words) are included to effectively utilize R1R2S2.
PDF collection to effectively utilize R1R2S2【Master RCI and Win!!】
https://www.gogojungle.co.jp/finance/navi/articles/93154
Please refer to the Investment Navi+ article above for the file names and titles of the PDFs to effectively use R1R2S2.
Below, we introduce examples of signals forR1R2S2.
Dow Jones Industrial Average US30 30-minute chart
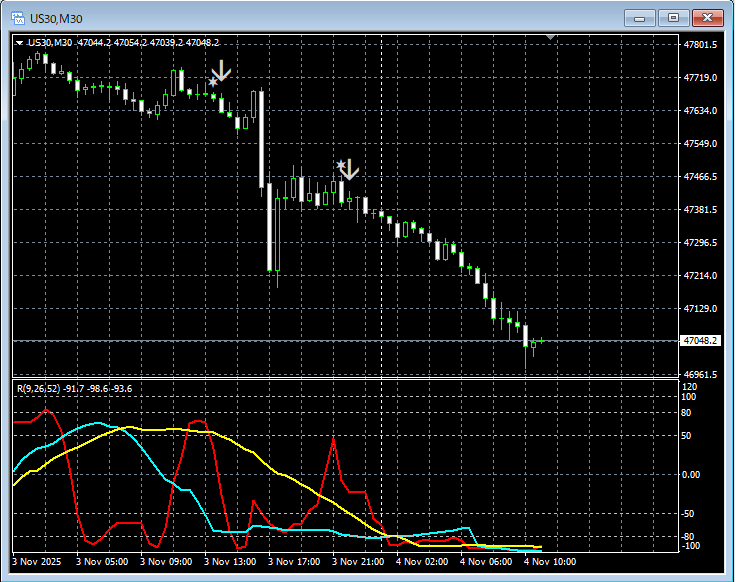
R1R2S2signals
In the chart above,R1R2S2 signalslight up at the right timing.
Waiting for mBDSR signals,mBDSR signalsdid not light up, were missed, or were late,R1R2S2 signalscan sometimes be used to respond,R1R2S2isused together withmBDSR
An indicator that shines in combination with RCI【BODSOR・mBDSR】
and methods / case studies (PDF) ★GogoJungle AWARD2020 winner★
https://www.gogojungle.co.jp/tools/indicators/11836
More than 550 PDF files (methods & case studies: over 1,950 pages, over 690,000 words) are included.
Most of them are examples that implement by linking higher and lower timeframes logically using the three RCI lines to consider multiple lower timeframes sequentially, and finally to wait for dips or rallies timing (i.e., mBDSR signals) on the lower timeframe.
In addition,many are focused on capturing points where multiple entry reasons overlap.There are also
manifests includes methods for exploring upside and downside targets using the three RCI lines.
In the PDF explanations,more than 1,900 chartsare used.


