

Battle-hardened【Mastering RCI to win with Moving Average Filter!!】USD/JPY 5-minute chart: breakout below supportive low and mBDSR’s rebound-selling signal
【RCI Related】 Blacksun Free Indicators and Free E-Books
https://www.gogojungle.co.jp/finance/navi/articles/90181
【Reference Video】
Bring to a signal using RCI through environment recognition and multi-timeframe analysis (1)
https://www.youtube.com/watch?v=1prvET_M5mA
Bring to a signal using RCI through environment recognition and multi-timeframe analysis (2)
https://www.gogojungle.co.jp/watch/1168
=================
【Mastering RCI!! Trend Reversal, Buy the Dip, Sell the Rally】
Indicators that excel in combination with RCI【BODSOR・mBDSR】
and techniques / case studies (PDF) ★GogoJungle AWARD 2020 Winner★
https://www.gogojungle.co.jp/tools/indicators/11836
※This product【BODSOR・mBDSR】includes more than 550 PDFs as techniques and case studies (totaling over 1,950 pages, over 1,900 charts, and over 690,000 characters).
mBDSR (RCI Filter)andmBDSR (Moving Average Filter)have different roles. The usage distinctions are also covered in the included PDFs.
mBDSR (Moving Average Filter)For the PDFs that explain it, please refer to the article in Investment Navi+ below for the file names and titles.
【Mastering RCI!!】Summary of PDFs explaining mBDSR (Moving Average Filter)
https://www.gogojungle.co.jp/finance/navi/articles/90127
Below, we introduce examples of signals formBDSR (Moving Average Filter)signals.
Dollar/Yen USDJPY 5-minute chart
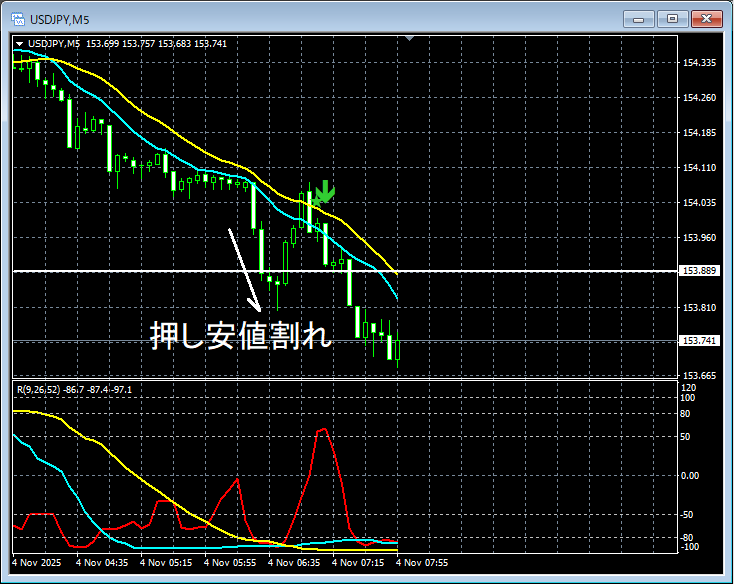
In the chart above,break of the minor low (upward momentum waning)and in the subsequent reboundmBDSR (Moving Average Filter) overbought signallights up at the right timing.
In the case of the Moving Average Filter mBDSRalsowhen used in conjunction with RCI's three-line top-down mapping from higher to lower timeframesa higher-probability trade is possible. This is also explained in theincluded PDF.
※The charts shown in this article may include added circles, lines, or rectangles for easier explanation, please note.
The indicator that shines in combination with RCI【BODSOR・mBDSR】
and techniques / case studies (PDF) ★GogoJungle AWARD 2020 Winner★
https://www.gogojungle.co.jp/tools/indicators/11836
Includes more than 550 PDF files (techniques and case studies: over 1,950 pages, over 690,000 characters).
Many of them are examples that link multiple timeframes top-down using the three-line RCI, sequentially analyzing conditions across multiple lower timeframes, and finally waiting for a dip buy or pullback sell signal on the lower timeframes (i.e., mBDSR signals).
Additionally,many are focused on identifying points where multiple entry reasons align..
Also included is a method to explore upside and downside targets using the RCI three-line setup.
In the PDF explanations,over 1,900 charts are used..

=================
Blacksun Indicators (List)
https://www.gogojungle.co.jp/finance/navi/articles/33779
=================


