

Battle-hardened [Mastering RCI to win!!] Counter trend line and mBDSR signals USD/JPY 5-minute chart
0
【RCI Related】Free Blacksun indicators and free e-books
https://www.gogojungle.co.jp/finance/navi/articles/90181
【Reference Video】
Bring into a form for environment recognition and multi-time-frame analysis using RCI to wait for a signal (Part 1)
https://www.youtube.com/watch?v=1prvET_M5mA
Bring into a form for environment recognition and multi-time-frame analysis using RCI to wait for a signal (Part 2)
https://www.gogojungle.co.jp/watch/1168
=================
【Mastering RCI!! Trend Reversal, Buy the Dip, Sell the Rally】
Indicator 【BODSOR・mBDSR】 that shines when combined with RCI
and its methods and case studies (PDF) ★GogoJungle AWARD 2020 winner★
https://www.gogojungle.co.jp/tools/indicators/11836
USDJPY – 5-minute chart
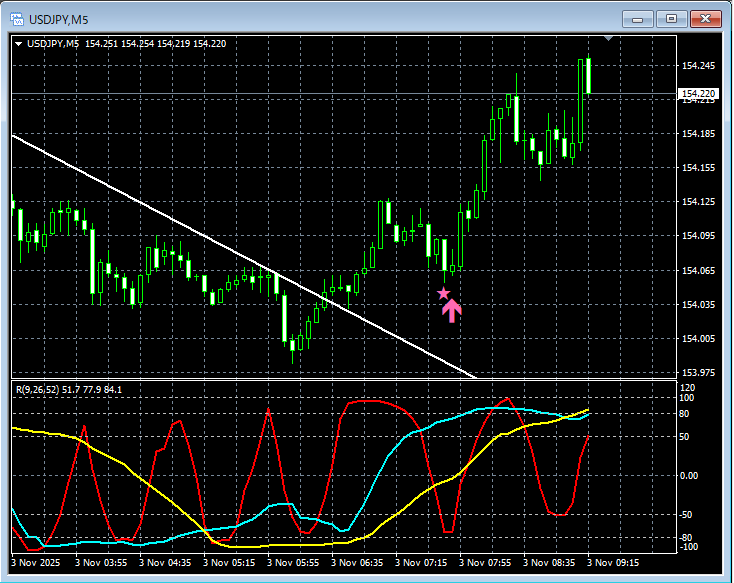
mBDSR (RCI two-curve filter)Signal
On the 5-minute chart above,mBDSR (RCI two-curve filter) buy-the-dip signallights up at the right timing.Counter-trend lineA common pattern is that after breaking above, a pullback buys light up.
Indicator that shines in combination with RCI【BODSOR・mBDSR】
and its methods and case studies (PDF) ★GogoJungle AWARD 2020 winner★
https://www.gogojungle.co.jp/tools/indicators/11836
Includes over 550 PDFs (methods & case studies: over 1,950 pages, over 690k characters).
Many of them aresummaries of examples where higher and lower timeframes are logically linked using three RCI lines to examine multiple lower-timeframe conditions in sequence, ultimately waiting for dip buys or rally sells in the lower timeframe (i.e., the signal of mBDSR)..
Additionally,there are many that emphasize capturing points where multiple entry grounds overlap..
Also,this includes methods that explore upside and downside targets using three RCI lines..
In the PDF explanations,more than 1,900 chartsare used.

=================
Blacksun Indicators (List)
https://www.gogojungle.co.jp/finance/navi/articles/33779
=================
× ![]()


