

Crush RCI to the extreme!! The sign for USD/JPY 15-minute chart of R1R2S2
【RCI Related】 Blacksun's Free Indicators and Free E-Books
https://www.gogojungle.co.jp/finance/navi/articles/90181
【Reference Video】
Bringing RCI-based environment recognition and multi-timeframe analysis to the point of waiting for a signal (1)
https://www.youtube.com/watch?v=1prvET_M5mA
Bringing RCI-based environment recognition and multi-timeframe analysis to the point of waiting for a signal (2)
https://www.gogojungle.co.jp/watch/1168
=================
【Master RCI!! Trend Reversal, Buy on Dips, Sell on Rises】
Indicators that are powerful in combination with RCI【BODSOR・mBDSR】
and Methods / Case Studies (PDF) ★GogoJungle AWARD2020 Winner★
https://www.gogojungle.co.jp/tools/indicators/11836
R1R2S2is included in the above product. For details, please read the article below on Investment Navi+.
R1R2S2 released: An indicator that uses 3 lines to target trend reversals, buy on dips, and sell on rallies, “R1R2S2”
※This product【BODSOR・mBDSR】comes with 358 PDFs (total over 1,400 pages, over 1,350 chart pages, over 470,000 characters) as standard when purchased.
※In addition to the PDFs above, there are 31 PDFs (methods & case studies: over 120 pages, over 115 chart pages, over 40,000 characters) included to effectively utilize R1R2S2.
PDF Collection to Effectively Use R1R2S2【Master RCI and Win!!】
https://www.gogojungle.co.jp/finance/navi/articles/93154
Please refer to the Investment Navi+ article above for the file names and titles of the PDFs to effectively use R1R2S2.
Below, we will introduce examples of signals forR1R2S2signals.
USD/JPY 15-minute chart
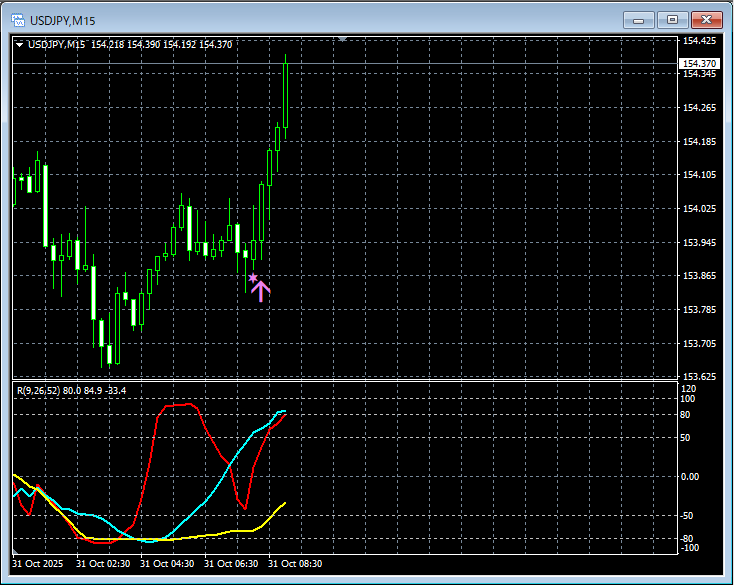
R1R2S2signal
In the chart above,R1R2S2 signallights up at the right timing.
Waiting for mBDSR signal,mBDSR signaldid not light up or was missed or lagged,R1R2S2 signalcan sometimes be used to respond,R1R2S2ismBDSRoften used in conjunction with.
Indicators that are powerful in combination with RCI【BODSOR・mBDSR】
and Methods / Case Studies (PDF) ★GogoJungle AWARD2020 Winner★
https://www.gogojungle.co.jp/tools/indicators/11836
Includes over 550 PDF files (Methods & Case Studies: total over 1,950 pages, over 690,000 characters).
Most of these are examples that summarize how to logically link higher and lower timeframes using the 3 RCI lines and then wait for a dip or pullback timing (i.e., mBDSR signal) on the lower timeframe.
Also,many focus on identifying points where multiple entry reasons coincide.There are also entries that explore potential upside and downside targets using the RCI three-line method.
In the PDF explanations,
over 1,900 charts are used.

=================
Blacksun Indicators (List)
https://www.gogojungle.co.jp/finance/navi/articles/33779
=================


