

Pragmatic and Robust FX mBDSR (RCI2 double filter) utilizes both the sign of R1R2S2 and the sign, EUR/CAD 4-hour chart
================================
【RCI Related】 Blacksun's Free Indicators and Free E-Books
https://www.gogojungle.co.jp/finance/navi/articles/90181
================================
Mastering RCI!! Trend Reversal, Buy on Dips, Sell on Rallies
Indicator that excels in combination with RCI: BODSOR・mBDSR
and method/case studies (PDF) ★GogoJungle AWARD 2020 Winner★
https://www.gogojungle.co.jp/tools/indicators/11836
R1R2S2is included in the above products. For details, please see the article below in Investment Navi+.
RCI 3-line “Two-Stage Confirmation” Indicator to Target Trend Reversals, Buy on Dips, and Sell on Rallies: “R1R2S2” Released!!
※This product 【BODSOR・mBDSR】 comes with a large set of PDFs as methods and case studies (358 PDFs total, over 1,400 pages, over 1,350 charts, over 470,000 words).
※In addition to the PDFs above, there are 31 PDFs (methods and case studies: over 120 pages, over 115 charts, over 40,000 words) to effectively utilize R1R2S2.
PDF Collection to Effectively Use R1R2S2【MASTER RCI!!】
https://www.gogojungle.co.jp/finance/navi/articles/93154
R1R2S2For the file names and titles of the PDFs to effectively utilize R1R2S2, please refer to the article above in Investment Navi+.
Below,mBDSR (RCI Two-Line Filter)andR1R2S2signs are shown simultaneously as examples.
EUR/CAD Euro Canadian
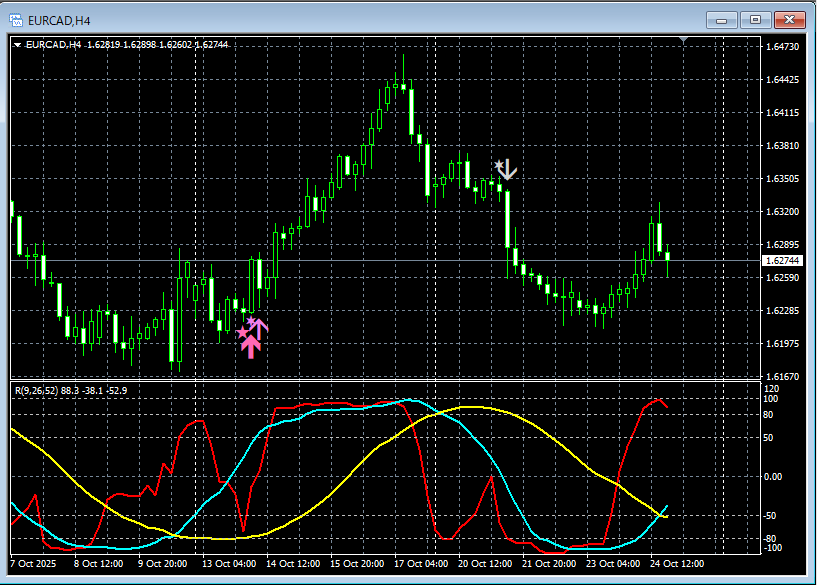
mBDSR (RCI Two-Line Filter)andR1R2S2signs
In the chart above,the signals of mBDSR (RCI two-line filter) and R1R2S2light up in a timely manner.
Using the RCI Three-Lineto map from higher timeframes to lower timeframes,waiting for the mBDSR signalto light up,when the mBDSR signaldoes not light up, or if you miss or are late to see the signal,R1R2S2 signalscan be used to respond,andR1R2S2mBDSR.
Indicators that shine in combination with RCI【BODSOR・mBDSR】
and method/case studies (PDF) ★GogoJungle AWARD 2020 Winner★
https://www.gogojungle.co.jp/tools/indicators/11836
They come with more than 550 PDF files (methods and case studies: over 1,950 pages, over 690,000 words).
Many of these areexamples that logically link higher and lower timeframes using the RCI three lines, and eventually break down to waiting for a dip-buy or pullback-sell timing (the mBDSR signal) on the lower timeframe.
Additionally,there are many that focus on catching points where multiple entry reasons overlap.
Also included is a method for exploring upward and downward targets using the RCI three lines.
In the PDF explanations,over 1,900 chartsare used.

================================
Blacksun Indicators (List)
https://www.gogojungle.co.jp/finance/navi/articles/33779
================================


