

Utilize both the sign of the quality and robustness of FX mBDSR (RCI2 two-filter) and the sign of R1R2S2 (61) CAD/JPY 4-hour chart
================================
[RCI Related] Free Indicators and Free E-Books from Blacksun
https://www.gogojungle.co.jp/finance/navi/articles/90181
================================
Become an RCI Master!! Trend Reversal, Buy on Dips, and Sell on Rallies
Indicators that work in tandem with RCI: BODSOR and mBDSR
Methods and Case Studies (PDF) ★GogoJungle AWARD 2020 Winner★
https://www.gogojungle.co.jp/tools/indicators/11836
R1R2S2is included in the above products. For details, please read the article below in the Investment Navi+.
RCI 3-Line “Two-Stage Confirmation” for Trend Reversal, Dip Buying, and Rally Selling: Release of Indicator “R1R2S2”!!
※This product【BODSOR・mBDSR】includes, as before, 358 PDFs (total over 1,400 pages, over 1,350 chart pages, over 470k characters) as part of the methods and case studies.
※In addition to the PDFs above, there are 31 PDFs (methods and case studies: over 120 pages, over 115 chart pages, over 40k characters) included to effectively utilize R1R2S2.
PDF Collection to Effectively Use R1R2S2【Master RCI!!】
https://www.gogojungle.co.jp/finance/navi/articles/93154
R1R2S2For the file names and titles of the PDFs to effectively use, please refer to the above Investment Navi+ article.
Below,mBDSR (RCI Two-Body Filter)andR1R2S2signs are shown simultaneously as an example.
CADJPY — Canadian Dollar JPY 4-Hour Chart
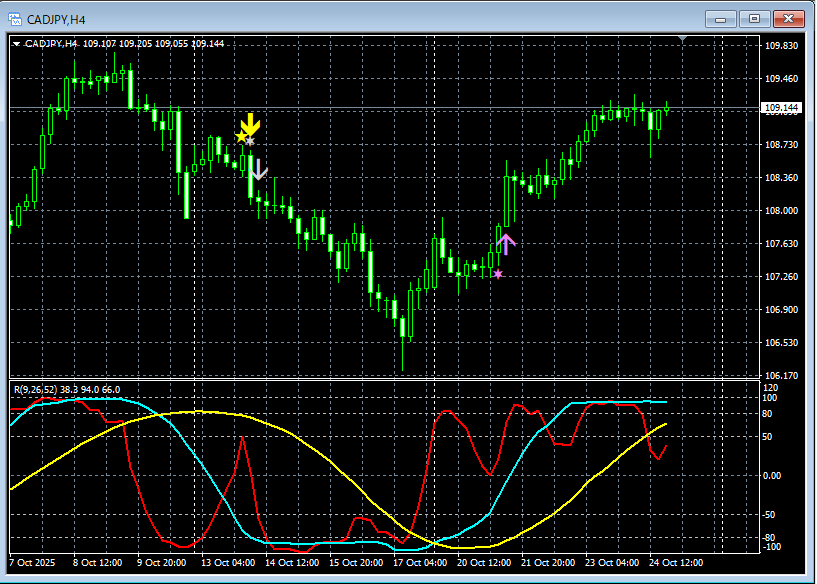
mBDSR (RCI Two-Body Filter)andR1R2S2
In the above chart,the signs of mBDSR (RCI Two-Body Filter)and R1R2S2 illuminate in a timely manner.
Using RCI Three-Lineto filter down from higher to lower timeframes,wait for the lighting of the mBDSR signalin the scenario,if the mBDSR signal does not light up or is missed or delayed,the R1R2S2 signalmay be used instead, andR1R2S2isoften used in conjunction withmBDSR.
Indicators that shine with the power of combining with RCI【BODSOR・mBDSR】
and their methods and case studies (PDF) ★GogoJungle AWARD 2020 Winner★
https://www.gogojungle.co.jp/tools/indicators/11836
More than 550 PDFs included (Methods and Case Studies: over 1,950 pages, over 690,000 characters).
Most of them areexamples that logically link higher and lower timeframes using the RCI three-line, sequentially analyzing multiple lower timeframes, and ultimately waiting for the timing of dips or rallies on the lower timeframes (i.e., signals from mBDSR)..
In addition,many focus on identifying points where multiple entry criteria overlap..
Also included are methods for exploring upside and downside targets using the RCI three lines.
In the PDF explanations,more than 1,900 chartsare used.

================================
Blacksun Indicators (List)
https://www.gogojungle.co.jp/finance/navi/articles/33779
================================


