

Master RCI to the extreme!! Sign of R1R2S2 USD/JPY 15-minute chart
===============================
[Iron Plate Pattern] Returning Highs with Fibonacci, RCI Oversold, and Signals of R1R2S2
Dollar/Yen 1-minute chart
https://www.gogojungle.co.jp/finance/navi/articles/97494
===============================
[Mastering RCI!! Trend Reversal, Buy on Dip, Sell on Rally]
Indicator that shines in combination with RCI【BODSOR・mBDSR】
and Methods & Case Studies (PDF) ★GogoJungle AWARD 2020 Winner★
https://www.gogojungle.co.jp/tools/indicators/11836
R1R2S2is included in the above products. For details, please see the article below in Investment Navi+.
RCI three-lines “Two-stage Confirmation” to target Trend Reversal, Buy the Dip, and Sell on Rally—Release of the indicator “R1R2S2”!!
※This product【BODSOR・mBDSR】includes, in addition to conventional methods and case studies, 358 PDFs (over 1,400 pages total, over 1,350 chart pages, over 470,000 words).
※In addition to the PDFs above, there are 31 PDFs (Methods & Case Studies: over 120 pages, over 115 chart pages, over 40,000 words) to effectively utilize R1R2S2.
PDF collection to effectively utilize R1R2S2【Master RCI!!】
https://www.gogojungle.co.jp/finance/navi/articles/93154
For the file names and titles of the PDFs to effectively utilize R1R2S2, please see the above Investment Navi+ article.
Below,Introduction to examples of signs forR1R2S2.
USDJPY Dollar/Yen 15-minute chart
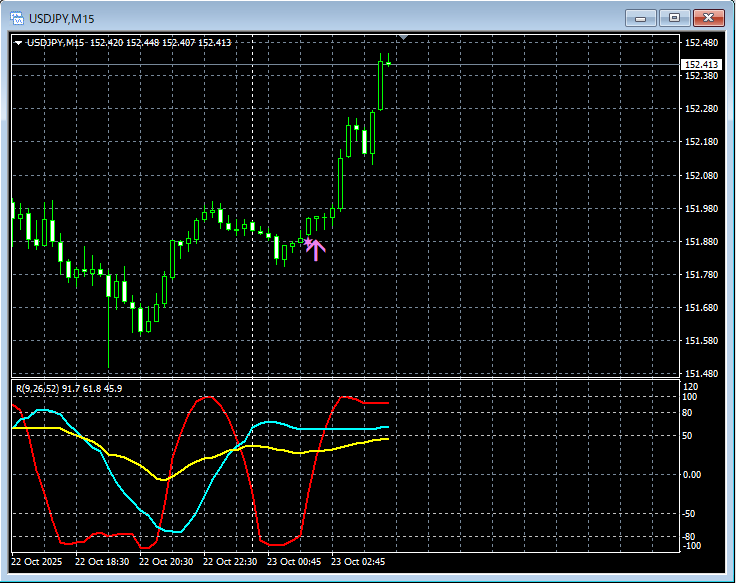
R1R2S2Signs
In the above chart,R1R2S2 signslight up at timely moments.
Sign of mBDSRwaiting scene,Sign of mBDSRR1R2S2can respond in some cases, andR1R2S2did not light up or was missed or delayed,is often used in conjunction withmBDSR.
Indicators that shine in combination with RCI【BODSOR・mBDSR】
and methods & case studies (PDF) ★GogoJungle AWARD 2020 Winner★
https://www.gogojungle.co.jp/tools/indicators/11836
More than 550 PDF files (Methods & Case Studies: total over 1,950 pages, over 690,000 words) are included.
Many of these are the examples showing the process of logically linking higher and lower timeframes using the RCI three-lines, ultimately waiting for buy-the-dip or sell-on-rally timing on the lower timeframes (i.e., mBDSR signs).
Additionally,there are many that focus on catching points where multiple entry reasons converge..
Also included is a method to explore upward and downward targets using the RCI three-lines.
In the PDF explanations,over 1,900 charts are used.

===============================
Blacksun Indicators (List)
https://www.gogojungle.co.jp/finance/navi/articles/33779
===============================


