

【Master RCI to Win!!】Signal for R1 R2 S2: EUR/AUD 1-hour and 30-minute charts
=================
【Iron Plate Pattern】Returns high and Fibonacci and RCI oversold and signs of R1R2S2
Dollar/Yen 1-minute chart
https://www.gogojungle.co.jp/finance/navi/articles/97494
=================
【Mastering RCI!! Trend reversal, pullback buying, return selling】
Indicator that shines in combination with RCI: BODSOR・mBDSR
and methods & case studies (PDF) ★GogoJungle AWARD2020 winner★
https://www.gogojungle.co.jp/tools/indicators/11836
R1R2S2is included in the above products. For details, please see the following Investment Navi+ article.
RCI 3-Lines “Two-Stage Judgment” to target trend reversal, pullback buying, and return selling: R1R2S2 released!!
※This product【BODSOR・mBDSR】comes with 358 PDFs (totaling over 1,400 pages, more than 1,350 chart sheets, over 470,000 words) as part of the methods and case studies.
※In addition to the PDFs above, 31 PDFs (methods & case studies: over 120 pages, more than 115 chart sheets, over 40,000 words) are included to effectively utilize R1R2S2.
PDF collection to effectively utilize R1R2S2【Mastering RCI!! Winning with it!!】
https://www.gogojungle.co.jp/finance/navi/articles/93154
Please refer to the above Investment Navi+ article for the file names and titles of the PDFs to effectively utilize R1R2S2.
Below, we introduce examples of signs forR1R2S2.
Euro/Australian Dollar EURAUD 30-minute chart
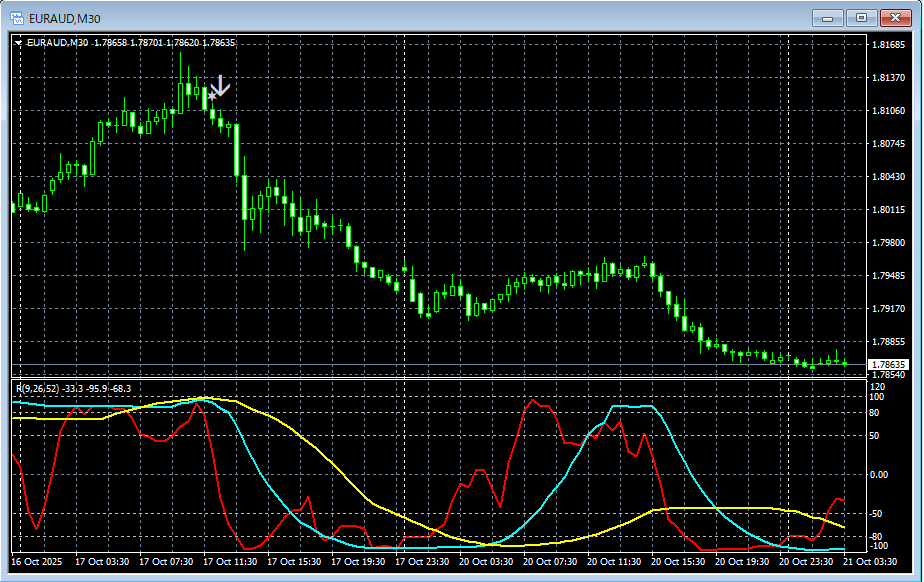
R1R2S2signs
Euro/Australian Dollar EURAUD 1-hour chart
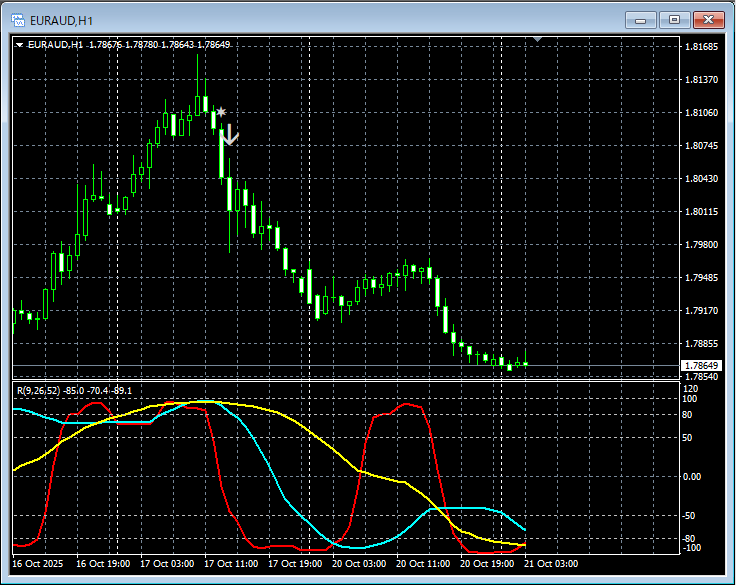
R1R2S2sign
In the chart above,R1R2S2 signlights up in time.
Waiting for mBDSR sign,when the mBDSR signdoes not light up, or when you miss or are late,R1R2S2 signcan be used to respond,R1R2S2ismBDSRand often used together with it.
Indicator that shines in combination with RCI【BODSOR・mBDSR】
and methods & case studies (PDF) ★GogoJungle AWARD2020 winner★
https://www.gogojungle.co.jp/tools/indicators/11836
Includes over 550 PDF files (methods & case studies: totaling over 1,950 pages, more than 690,000 words).
Most of them areexamples that lay out a plan to logically link the higher and lower timeframes using the three RCI lines, then sequentially consider multiple lower-timeframe conditions, ultimately waiting for pullbacks or returns on the lower timeframe (the mBDSR sign)..
Also,many focus on capturing points where multiple entry reasons overlap..
Additionally,there are methods to explore upside and downside targets using the three RCI lines..
In the PDF descriptions,over 1,900 chartsare used.

=================
Blacksun's Indicators (List)
https://www.gogojungle.co.jp/finance/navi/articles/33779
=================


