

[Master RCI and win with an Extremely Moving Average Filter!!] Sign of mBDSR on the USD/JPY 1-hour chart
================================
【RCI Related】 Blacksun's Free Indicator and Free E-Book
https://www.gogojungle.co.jp/finance/navi/articles/90181
================================
【Master RCI!! Trend Reversal, Buy on Dips, Sell on Rallies】
Indicator that shines when used with RCI: 【BODSOR・mBDSR】
and Method / Case Studies (PDF) ★GogoJungle AWARD2020 winner★
https://www.gogojungle.co.jp/tools/indicators/11836
※This product【BODSOR・mBDSR】comes with over 550 PDFs as methods and case studies (total over 1,950 pages, over 1,900 chart images, over 690,000 characters).
mBDSR (RCI Filter)andmBDSR (Moving Average Filter)have different roles. The usage distinctions are also covered in the accompanying PDF.
mBDSR (Moving Average Filter)For the PDFs that explain it, please refer to the investment navigation+ article below for the file name and title.
【Master RCI and Win!!】Summary of PDFs Explaining mBDSR (Moving Average Filter)
https://www.gogojungle.co.jp/finance/navi/articles/90127
Below, we introduce the sign examples ofmBDSR (Moving Average Filter)signals.
USD/JPY 1-hour chart
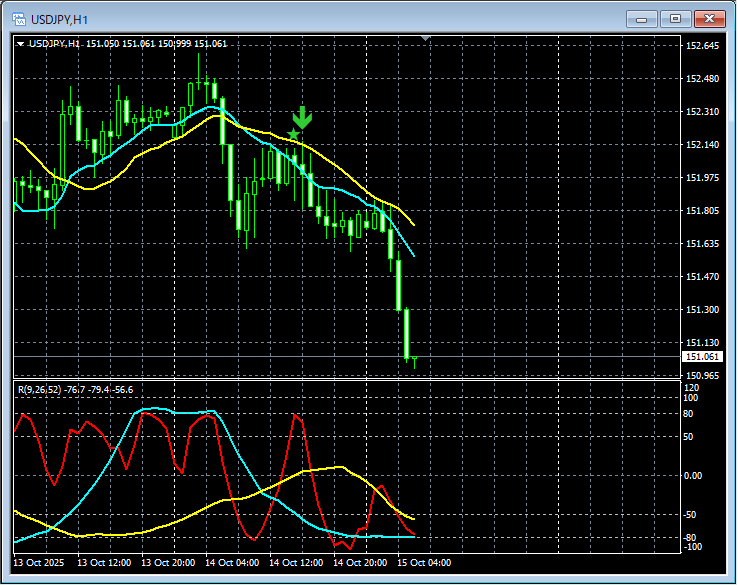
In the above chart,mBDSR (Moving Average Filter)signals light up at timely points.
For the Moving Average Filter mBDSRas wellWhen combined with RCI's three-line down from higher timeframe to lower timeframe, it enables higher-probability trades. This is also explained in theAccompanying PDF.
※Please note that for chart illustrations in this article, for ease of explanation, circles, straight lines, and rectangles may be added.
Indicators that shine when combined with RCI【BODSOR・mBDSR】
and Method / Case Studies (PDF) ★GogoJungle AWARD2020 winner★
https://www.gogojungle.co.jp/tools/indicators/11836
Includes over 550 PDF files (methods and case studies: total over 1,950 pages, over 690,000 characters).
Most of them aresummaries of how to logically link higher and lower timeframes using the three-line RCI, sequentially considering multiple lower timeframes, and ultimately waiting for the lower timeframe signals of dip-buying or pullback selling (i.e., mBDSR signals)..
Furthermore,many focus on identifying points where multiple entry reasons overlap..
Additionally,there is also a method to explore upside and downside targets using the RCI three-line system..
In the PDF explanations,more than 1,900 charts are used..

================================
Blacksun Indicators (List)
https://www.gogojungle.co.jp/finance/navi/articles/33779
================================


