

[Master RCI and win with a moving average filter!!] Yesterday's AUDJPY 15-minute chart sign of mBDSR
=================
【RCI Related】 Free Indicators and Free E-books from Blacksun
https://www.gogojungle.co.jp/finance/navi/articles/90181
=================
【Master RCI!! Trend Reversal, Buy on Dips, Sell on Rallies】
Indicators that work powerfully when combined with RCI【BODSOR・mBDSR】
and methods/case studies (PDF) ★GogoJungle AWARD2020 Winner★
https://www.gogojungle.co.jp/tools/indicators/11836
※This product【BODSOR・mBDSR】comes with over 550 PDFs (totaling more than 1,950 pages, more than 1,900 chart images, and over 690,000 characters) as part of the manual and case studies.
mBDSR (RCI Filter)andmBDSR (Moving Average Filter)have different roles. The accompanying PDF discusses how to use them differently.
mBDSR (Moving Average Filter)For the PDFs that explain it, please see the investment guide plus article below for file names and titles.
【Master RCI and Win!!】Summary of PDFs Explaining mBDSR (Moving Average Filter)
https://www.gogojungle.co.jp/finance/navi/articles/90127
Below,mBDSR (Moving Average Filter)sign examples are introduced.
AUD/JPY 15-minute chart
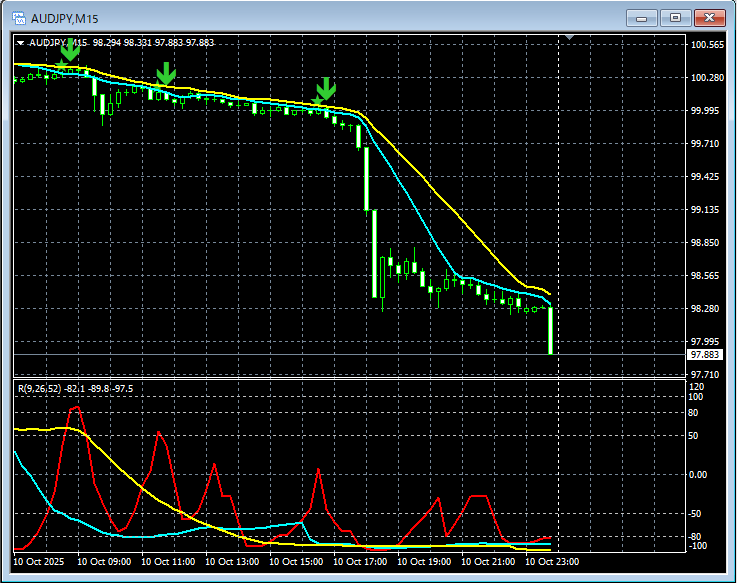
In the above chart,mBDSR (Moving Average Filter)signs light up at well-timed moments.
In the case of the Moving Average Filter mBDSRas wellusing the top-down approach with the three RCI linesand combining it with lower time frames enables high-probability trades. This is also explained in thePDFincluded.
※ Please note that the charts shown in this article may include circles, lines, and squares for explanatory convenience.
Indicators that work powerfully when combined with RCI【BODSOR・mBDSR】
and methods/case studies (PDF) ★GogoJungle AWARD2020 Winner★
https://www.gogojungle.co.jp/tools/indicators/11836
More than 550 PDF files (methods/case studies: total over 1,950 pages, over 690,000 characters) are included.
Many of these areexamples where the three RCI lines link higher and lower time frames logically, examining multiple lower time frames sequentially, finally waiting for a dip buy or a pullback (i.e., mBDSR signals) on the lower time frame..
Additionally,there are many that focus on identifying points where multiple entry reasons coincide..
Also included is a method for exploring upside and downside targets using the three RCI lines.
In the PDF explanations,more than 1,900 charts are used..

=================
Blacksun Indicators (List)
https://www.gogojungle.co.jp/finance/navi/articles/33779
=================


