

[Master RCI and win with a moving average filter!!] Yesterday's USD/JPY 30-minute and 15-minute mBDSR signals
==================================================
【RCI Related】 Blacksun's Free Indicators and Free eBooks
https://www.gogojungle.co.jp/finance/navi/articles/90181
==================================================
【Master RCI!! Trend Reversal, Pullback Buying, and Pullback Selling】
Indicators that pair powerfully with RCI: 【BODSOR・mBDSR】
and Methods & Case Studies (PDF) ★GogoJungle AWARD 2020 Winner★
https://www.gogojungle.co.jp/tools/indicators/11836
※This product【BODSOR・mBDSR】includes more than 550 PDFs as methods and case studies (total over 1,950 pages, over 1,900 chart sheets, over 690,000 words).
mBDSR (RCI Filter)andmBDSR (Moving Average Filter)have different roles. The accompanying PDFs also discuss how to use them appropriately.
mBDSR (Moving Average Filter)For PDFs with explanations, please see the file names and titles in the following Investment Navi+ article.
【Mastering RCI!!】Summary of PDFs Explaining mBDSR (Moving Average Filter)
https://www.gogojungle.co.jp/finance/navi/articles/90127
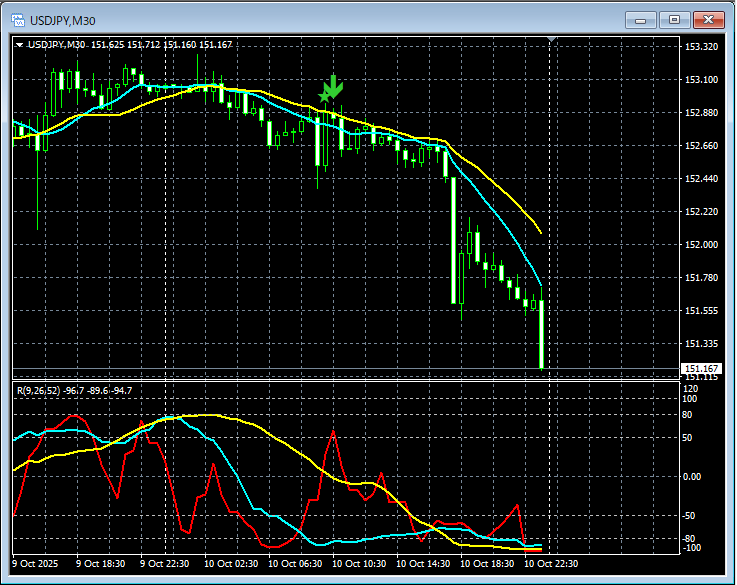
Below, we introduce examples of signals formBDSR (Moving Average Filter)signals.
USDJPY - Dollar/Yen 30-minute chart
USDJPY - Dollar/Yen 15-minute chart
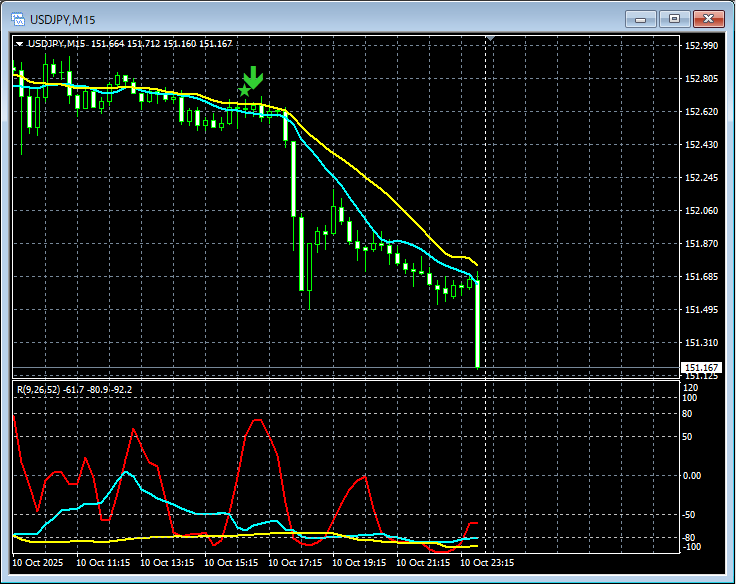
In the above chart,mBDSR (Moving Average Filter)signals light up at timely moments.
Regarding Moving Average Filter mBDSRas well,Using it in conjunction with the higher-timeframe to lower-timeframe alignment using the 3-line RCIcan enable high-probability trades. This is also explained in theaccompanying PDF.
Note: Some charts in this article include added circles, lines, and boxes for explanatory convenience.
Indicator that shines when combined with RCI【BODSOR・mBDSR】
and Methods & Case Studies (PDF) ★GogoJungle AWARD 2020 Winner★
https://www.gogojungle.co.jp/tools/indicators/11836
More than 550 PDF files (Methods & Case Studies: over 1,950 pages, over 690,000 words) are included.
Most of them areexamples that link higher- and lower-timeframe logically by using the three-line RCI, examining multiple lower-timeframe conditions sequentially, and ultimately waiting for pullback buying or pullback selling signals on the lower timeframe (i.e., mBDSR signals)..
Also,many emphasize identifying points where multiple entry reasons align..
Additionally,there are methods to explore upside and downside targets using the RCI three-line approach..
In the PDF explanations,over 1,900 charts are used..

==================================================
Blacksun Indicators (List)
https://www.gogojungle.co.jp/finance/navi/articles/33779
==================================================


