

Substance and Strength FX【Master RCI with Moving Average Filter to Win!! USD/JPY 30-minute Chart】mBDSR Sign
===============================================
【RCI Related】 Blacksun Free Indicator and Free E-books
https://www.gogojungle.co.jp/finance/navi/articles/90181
===============================================
【Master RCI!! Trend Reversal, Buying on Dips, Selling on Rallies】
Indicators that work powerfully when combined with RCI【BODSOR・mBDSR】
and methods & case studies (PDF) ★GogoJungle AWARD 2020 Winner★
https://www.gogojungle.co.jp/tools/indicators/11836
※This product【BODSOR・mBDSR】comes with the traditional methods & case studies, including 358 PDFs (over 1,400 pages total, over 1,350 chart pages, over 470,000 words).
mBDSR (RCI Filter)andmBDSR (Moving Average Filter)have different roles. The usage distinctions are also described in the included PDF.
mBDSR (Moving Average Filter)For the file name and title of the PDF that includes explanations, please refer to the article below in Investment Navi+.
【Master RCI and Win!!】Summary of PDFs with explanations of mBDSR (Moving Average Filter)
https://www.gogojungle.co.jp/finance/navi/articles/90127
Below, we introduce examples of signals formBDSR (Moving Average Filter)signals.
USD/JPY 30-minute chart
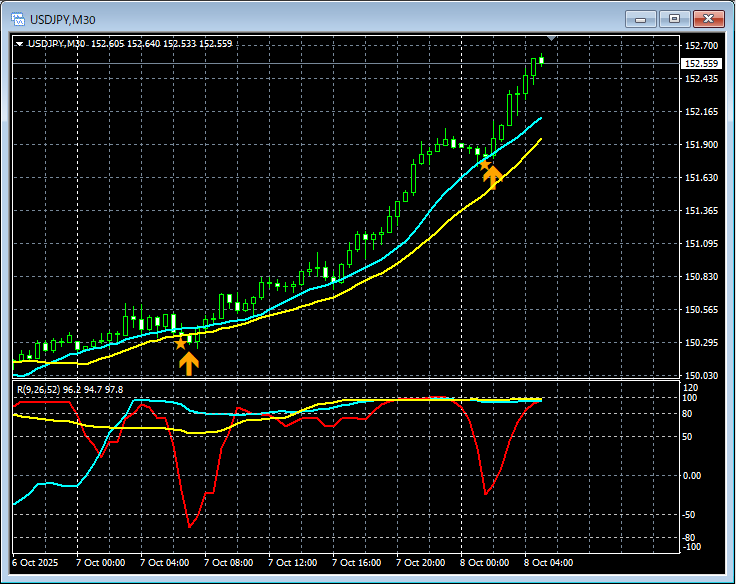
In the chart above,mBDSR (Moving Average Filter)signals light up at timely moments.
In the case of the Moving Average Filter mBDSRas well,When combined with the top-down approach using three RCI linesto link higher and lower timeframes, you can achieve highly advantageous trades. This is also explained in theincluded PDF.
※Please note that the charts shown in this article may have added circles, straight lines, or rectangles for explanatory convenience.
Indicators that shine when combined with RCI【BODSOR・mBDSR】
and methods & case studies (PDF) ★GogoJungle AWARD 2020 Winner★
https://www.gogojungle.co.jp/tools/indicators/11836
More than 550 PDF files (Methods & Case Studies: over 1,950 pages, over 690,000 words) are included.
Most of them areexamples that logically link higher and lower timeframes using three RCI lines to examine multiple lower-timeframe situations in sequence, ultimately waiting for dips or rallies on the lower timeframe via the mBDSR signals..
Also,many focus on capturing points where multiple entry reasons coincide..
Additionally,there are methods to explore upward and downward targets using the RCI three-line strategy..
In the PDF explanations,over 1,900 chartsare used.

===============================================
Blacksun Indicators (List)
https://www.gogojungle.co.jp/finance/navi/articles/33779
===============================================


