

【Master RCI to Win!!】Signal for AUDJPY 5-minute chart R1R2S2
========================================
[Iron Plate Pattern] Returning High, Fibonacci, RCI Oversold, and Signs of R1R2S2
Dollar-Yen 1-minute chart
https://www.gogojungle.co.jp/finance/navi/articles/97494
========================================
[Mastering RCI!! Trend Reversal, Buy Dips, and Sell Rallies]
Indicator that shines with RCI when combined with BODSOR and mBDSR
and Approach/Case Studies (PDF) ★GogoJungle AWARD2020 winner★
https://www.gogojungle.co.jp/tools/indicators/11836
R1R2S2is included in the above products. For details, please see the Investment Navi+ article below.
RCI 3-line ‘Two-Stage Judgment’ to target trend reversals, dip buy, and rally sell — R1R2S2 release!!
※The product [BODSOR, mBDSR] comes with more than 358 PDFs (total over 1,400 pages, over 1,350 charts, and more than 470,000 characters) as part of the method and case studies.
※In addition to the above PDFs, there are 31 PDFs (methods and case studies: over 120 pages, over 115 charts, over 40,000 characters) to effectively utilize R1R2S2.
PDF Collection for Effectively Using R1R2S2 [Mastering RCI!!]
https://www.gogojungle.co.jp/finance/navi/articles/93154
Please see the Investment Navi+ article above for the file names and titles of the PDFs to effectively use R1R2S2.
Below, we introduce examples of signs forR1R2S2.
Australian Dollar/Yen AUDJPY 5-minute chart
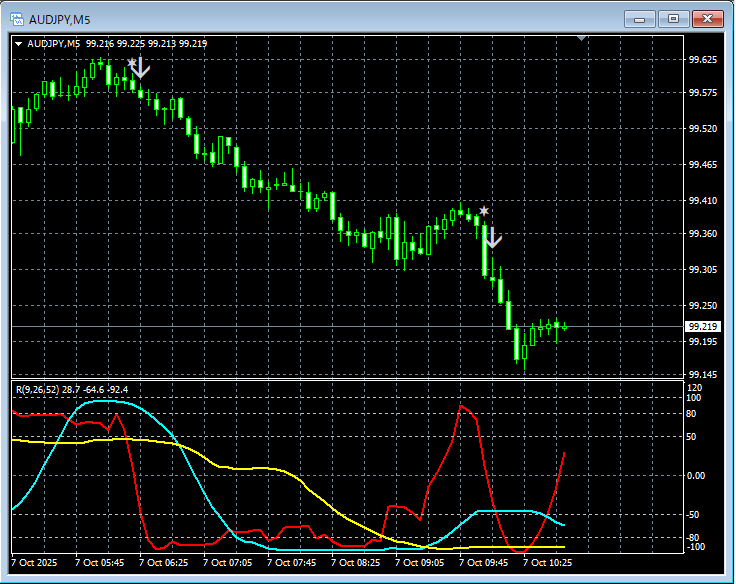
R1R2S2Signs
In the above chart,R1R2S2 signslight up at the right timing.
Waiting for mBDSR signs,mBDSR signsdid not light up, or signs were missed or delayed,R1R2S2 signscan respond, andR1R2S2is often used in conjunction withmBDSR.
Indicator that shines with RCI combination【BODSOR・mBDSR】
and approach/case studies (PDF) ★GogoJungle AWARD2020 recipient★
https://www.gogojungle.co.jp/tools/indicators/11836
More than 550 PDF files (approach/case studies: over 1,950 pages, over 690,000 characters) are included.
Many of them describe how to logically link higher and lower timeframes using the RCI three-line setup, sequentially analyze multiple lower-timeframe conditions, and ultimately wait for a dip buy or rally sell signal on the lower timeframe (the mBDSR sign).
Also,many emphasize identifying points where multiple entry reasons overlap..
Note thatthere are also methods that explore target upside or downside using the RCI three-line setup..
In the PDF explanations,over 1,900 chartsare used.

========================================
Blacksun's Indicators (List)
https://www.gogojungle.co.jp/finance/navi/articles/33779
========================================


