

Master RCI to win greatly!! Sign of R1R2S2 USD/CHF JPY 15-minute chart
===============================================
[Iron Plate Pattern] Signs of returning high, Fibonacci, RCI oversold, and R1R2S2
USDJPY 1-minute chart
https://www.gogojungle.co.jp/finance/navi/articles/97494
===============================================
[Mastering RCI!! Trend Reversal, Buy on Dips, Sell on Rallies]
Indicator【BODSOR・mBDSR】that shines when combined with RCI
and methods & case studies (PDF) ★GogoJungle AWARD 2020 winner★
https://www.gogojungle.co.jp/tools/indicators/11836
R1R2S2is included in the products above. For details, please read the Investment Navi+ article below.
RCI triple-line “2-step judgment” to target trend reversals, buy on dips, and sell on rallies – R1R2S2 released!!
*This product【BODSOR・mBDSR】comes with conventional PDFs of 358 files (total over 1,400 pages, over 1,350 chart pages, over 470,000 characters) as part of the methods & case studies.
*In addition to the above PDFs, there are 31 PDFs (methods & case studies: over 120 pages, over 115 chart pages, over 40,000 characters) to effectively utilize R1R2S2.
PDF collection to effectively utilize R1R2S2【Master RCI to Win!!】
https://www.gogojungle.co.jp/finance/navi/articles/93154
Please refer to the Investment Navi+ article above for the file names and titles of the PDFs to effectively utilize R1R2S2.
Below, we introduce examples of signs forR1R2S2signals.
Swiss Franc / Yen CHFJPY 15-minute chart
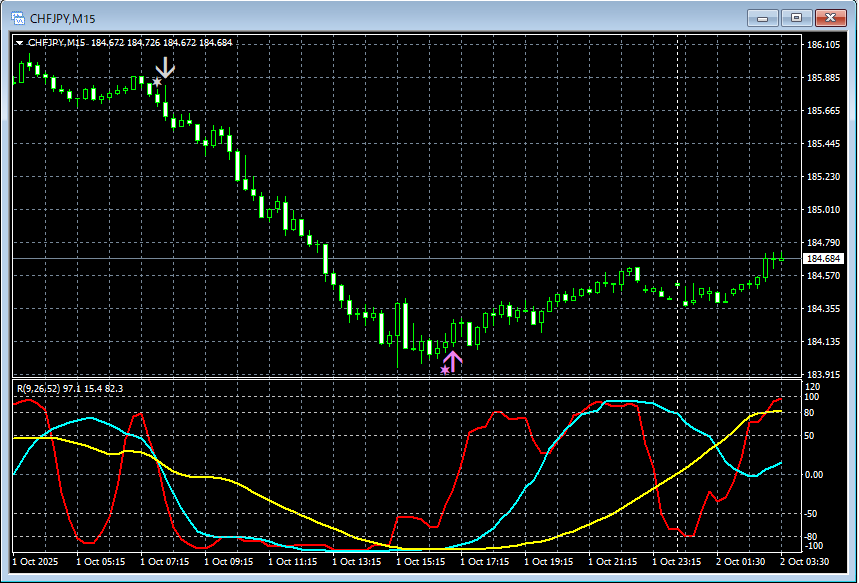
R1R2S2signals
On the above chart,R1R2S2signals are lighting up at the right timing.
Waiting for mBDSR signalsis a common scenario,mBDSR signalsdid not light up, or you missed or were late,R1R2S2 signalscan sometimes be used to respond,R1R2S2ismBDSRoften used in conjunction with.
Indicator that shines when combined with RCI【BODSOR・mBDSR】
and methods & case studies (PDF) ★GogoJungle AWARD 2020 winner★
https://www.gogojungle.co.jp/tools/indicators/11836
Over 550 PDF files (methods & case studies: total over 1,950 pages, over 690,000 characters) are included.
Many of these areexamples that break down multiple lower-timeframe situations by linking higher and lower timeframes logically using the three RCI lines, ultimately waiting for the timing of dips or rallies on the lower timeframes (i.e., mBDSR signals)..
Additionally,many focus on capturing points where multiple entry reasons overlap..
Also included is a method to explore upside and downside targets using RCI’s three lines.
In the PDF explanations,over 1,900 chartsare used.

===============================================
Blacksun’s indicators (List)
https://www.gogojungle.co.jp/finance/navi/articles/33779
===============================================


