

【Master RCI!!】Signal for AUD/JPY 15-minute chart of R1R2S2
===============================
[Iron-clad Pattern] Return high, Fibonacci, RCI oversold, and R1R2S2 signals
USD/JPY 1-minute chart
https://www.gogojungle.co.jp/finance/navi/articles/97494
===============================
[Mastering RCI!! Trend reversal, pullback buying, and pullback selling]
Indicator that shines in combination with RCI: [BODSOR・mBDSR]
and techniques & case studies (PDF) ★GogoJungle AWARD 2020 winner★
https://www.gogojungle.co.jp/tools/indicators/11836
R1R2S2is included in the above products. For details, please read the investment navigator+ article below.
RCI 3 lines with a “two-step” confirmation to target trend reversal, pullback buying, and pullback selling: the R1R2S2 release!!
※The product [BODSOR・mBDSR] comes with a large PDF package as a method & case study (358 PDFs, over 1,400 pages, more than 1,350 chart pages, over 470,000 characters).
※In addition to the above PDFs, there are 31 PDFs (methods & case studies: over 120 pages, over 115 chart pages, over 40,000 characters) to effectively utilize R1R2S2.
PDF collection to effectively utilize R1R2S2【Master RCI to win!!】
https://www.gogojungle.co.jp/finance/navi/articles/93154
Please refer to the above investment navigator+ article for the file names and titles of the PDFs to effectively utilize R1R2S2.
Below, we introduce examples of signals forR1R2S2.
AUD/JPY 15-minute chart
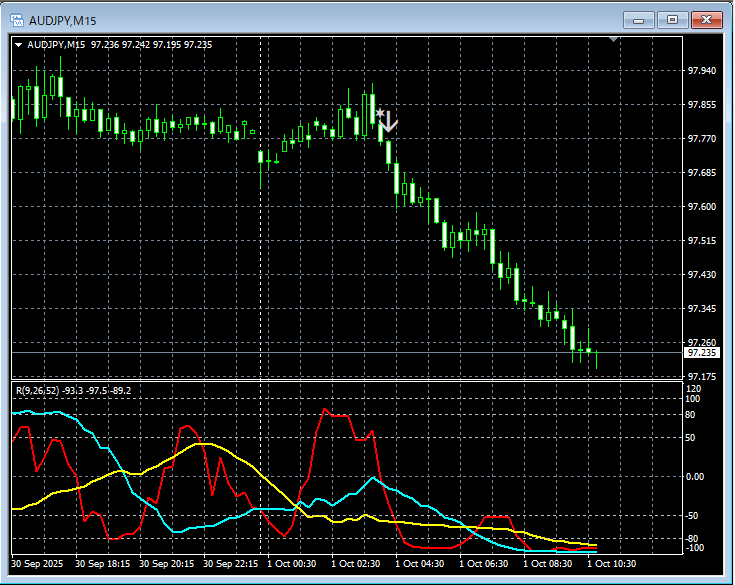
R1R2S2signals
In the above chart,R1R2S2 signalslight up at timely moments.
Waiting for the mBDSR signals,mBDSR signals did not light up, or you missed them or were late,R1R2S2 signalsR1R2S2ismBDSRoften used in conjunction.
Indicator that shines in combination with RCI【BODSOR・mBDSR】
and methods & case studies (PDF) ★GogoJungle AWARD 2020★
https://www.gogojungle.co.jp/tools/indicators/11836
Includes over 550 PDFs (methods & case studies: over 1,950 pages, over 690,000 characters).
Most of them areexamples that logically link higher and lower timeframes using the RCI 3-line framework to sequentially analyze multiple lower timeframes and ultimately wait for pullback buying or pullback selling timing (the mBDSR signal) on the lower timeframe.
Also,many focus on pinpointing points where multiple entry reasons overlap.
In addition,there is a method to explore upside targets and downside targets using the three-line RCI..
In the PDF explanations,over 1,900 chartsare used.

===============================
Blacksun’s Indicators (List)
https://www.gogojungle.co.jp/finance/navi/articles/33779
===============================


