

Master RCI to the extreme!! Signs of pressing price breakdown and R1R2S2 Pound-Dollar 1-hour chart
=================
[Iron Clad Pattern] Reversal Highs, Fibonacci, and RCI Oversold Signals with R1R2S2
USD/JPY 1-minute chart
https://www.gogojungle.co.jp/finance/navi/articles/97494
=================
[Mastering RCI!! Trend Reversal, Buy-the-Dip, Sell on Pullback]
Indicator power with RCI when combined with BODSOR and mBDSR
and methodology and case study (PDF) ★GogoJungle AWARD 2020 winner★
https://www.gogojungle.co.jp/tools/indicators/11836
R1R2S2is included in the above products. For details, please read the following Investment Navi+ articles.
RCI 3-line “Two-Stage Confirmation” Indicator for Trend Reversal, Buy-the-Dip, and Sell on Pullback: R1R2S2 Released!!
※ This product [BODSOR・mBDSR] includes, from the previous version, 358 PDFs (total over 1,400 pages, over 1,350 chart pages, over 470,000 characters) as part of the method and case studies.
※ In addition to the PDFs above, there are 31 PDFs (method and case studies: over 120 pages, over 115 chart pages, over 40,000 characters) included to effectively utilize R1R2S2.
PDF collection to effectively utilize R1R2S2 [Mastering RCI to Win!!]
https://www.gogojungle.co.jp/finance/navi/articles/93154
Please refer to the Investment Navi+ article above for the filenames and titles of the PDFs to effectively utilize R1R2S2.
Below, we will present examples of signals forR1R2S2.
GBP/USD, GBPAUD, 1-hour chart
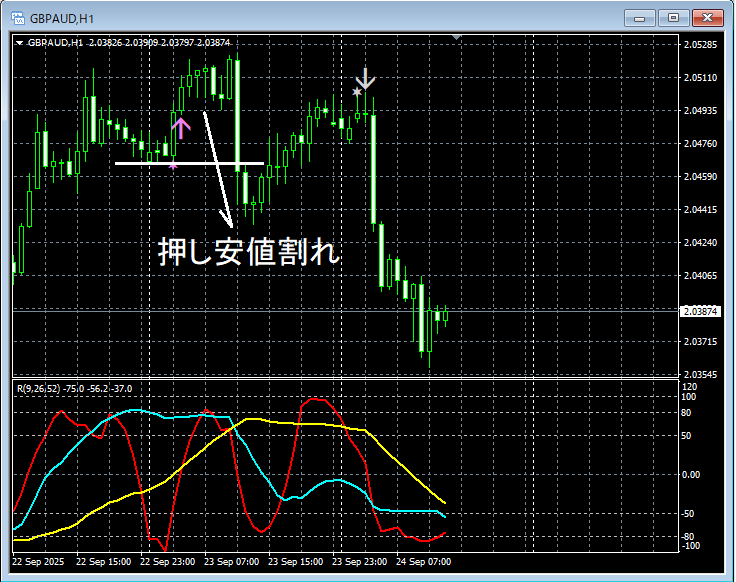
R1R2S2signals
In the chart above,R1R2S2 signalslight up at the right timing.
Waiting for mBDSR signals,mBDSR signalsdid not light up, were missed, or arrived late,R1R2S2 signalscan sometimes be used to respond, andR1R2S2ismBDSRoften used in conjunction with.
The indicator [BODSOR・mBDSR], powerful when combined with RCI
and methodology and case studies (PDF) ★GogoJungle AWARD2020 winner★
https://www.gogojungle.co.jp/tools/indicators/11836
Includes over 550 PDF files (method and case studies: over 1,950 pages, over 690,000 characters).
Many of them are aboutusing the RCI 3-line setup to logically link higher and lower timeframes, then sequentially analyzing multiple lower timeframes, ultimately waiting for a dip buying or pullback timing (i.e., mBDSR signals) on the lower timeframe.
Also,many emphasize capturing points where multiple entry reasons coincide.
Additionally,there are methods to explore upside and downside targets using RCI three lines..
In the PDF explanations,more than 1,900 chartsare used.

=================
Blacksun Indicators (List)
https://www.gogojungle.co.jp/finance/navi/articles/33779
=================


