

Incorporating both the sign of the qualitative solid FX mBDSR (RCI2 double-filter) and the signs of R1R2S2 (54) Dollar/Canada 15-minute chart
========================================
【RCI Related】 Blacksun Free Indicators and Free E-Books
https://www.gogojungle.co.jp/finance/navi/articles/90181
========================================
【Mastering RCI!! Trend Reversal, Breakout Buy, and Pullback Sell】
Indicators that work in combination with RCI: 【BODSOR・mBDSR】
and Methods & Case Studies (PDF) ★GogoJungle AWARD2020 Winner★
https://www.gogojungle.co.jp/tools/indicators/11836
R1R2S2is included in the above products. For details, please read the article below in Investment Navi+.
RCI 3-line “Two-Stage Confirmation” to target trend reversals, pullback buys, and pullback sells: R1R2S2 Release!!
※This product【BODSOR・mBDSR】comes with 358 PDFs (Total over 1,400 pages, over 1,350 chart pages, over 470,000 words) as part of the methods and case studies.
※In addition to the PDFs above, 31 PDFs (Methods & Case Studies: over 120 pages, over 115 charts, over 40,000 words) are included to effectively utilize R1R2S2.
PDF Collection to Effectively Utilize R1R2S2: 【Master RCI and Win!!】
https://www.gogojungle.co.jp/finance/navi/articles/93154
R1R2S2For the filenames and titles of the PDFs to effectively utilize, please refer to the above Investment Navi+ article.
Below,mBDSR (RCI two-line filter) andR1R2S2 are shown with signals displayed simultaneously.
USD/CAD 15-minute chart
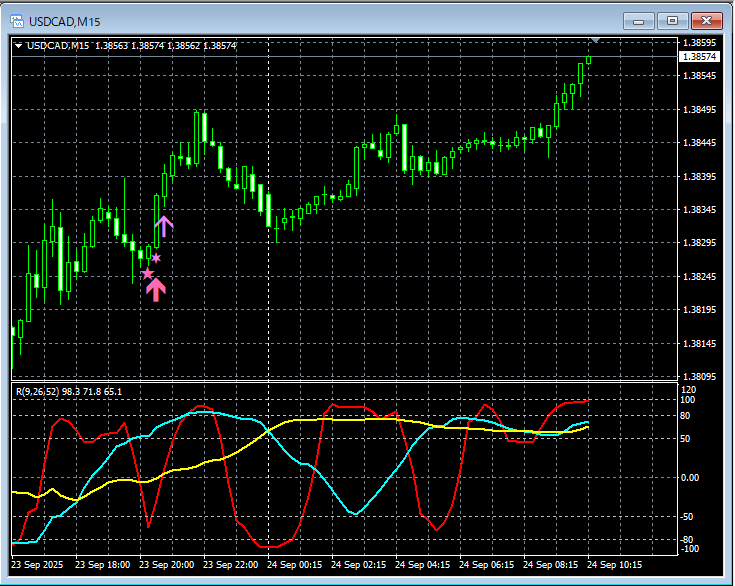
mBDSR (RCI two-line filter) andR1R2S2 signals
In the above chart,signals of mBDSR (RCI two-line filter) and R1R2S2 light up in timing.
RCI three-line is used to descend from higher timeframes to lower timeframes,waiting for the mBDSR signal to light up, andwhen the mBDSR signal does not light up or is missed or late,the R1R2S2 signal can be used to respond,R1R2S2 isoften used together with mBDSR
Indicators that shine with RCI in combination: 【BODSOR・mBDSR】
and Methods & Case Studies (PDF) ★GogoJungle AWARD2020 Winner★
https://www.gogojungle.co.jp/tools/indicators/11836
Includes over 550 PDF files (Methods & Case Studies: totaling over 1,950 pages, over 690,000 words).
Most of these aresummaries of examples that logically link higher and lower timeframes using the RCI three-line to sequentially consider multiple lower timeframes, ultimately waiting for pullback buys or pullback sells (the mBDSR signals) on the lower timeframes..
In addition,many are focused on capturing points where multiple entry reasons overlap..
Also included is a technique for exploring upper and lower targets using the RCI three-line.
In the PDF explanations,over 1,900 charts are used.

========================================
Blacksun Indicators (List)
https://www.gogojungle.co.jp/finance/navi/articles/33779
========================================
× ![]()


