

Utilize both the sign of the sturdy and robust FX mBDSR (RCI2 two-filter) and the sign of R1R2S2 (53) USD/JPY 15-minute chart
0
================================
【RCI Related】 Blacksun's Free Indicator and Free E-Book
https://www.gogojungle.co.jp/finance/navi/articles/90181
================================
【Mastering RCI!! Trend Reversal, Buy on Dips, Sell on Rallies】
Indicators that shine when used with RCI: 【BODSOR・mBDSR】
and methodology / case studies (PDF) ★GogoJungle AWARD 2020 Winner★
https://www.gogojungle.co.jp/tools/indicators/11836
R1R2S2is included in the above products. For details, please see the article below in Investment Navi+.
RCI 3-line "Two-Stage Confirmation" to Target Trend Reversal, Buy on Dips, Sell on Rallies: R1R2S2 Released!!
※This product [BODSOR・mBDSR] includes, as before, 358 PDFs (total over 1,400 pages, over 1,350 chart pages, over 470,000 characters) as part of the methodology and case studies.
※In addition to the above PDFs, there are 31 PDFs (methodology & case studies: over 120 pages, over 115 charts, over 40,000 characters) included to effectively utilize R1R2S2.
PDF Collection to Effectively Utilize R1R2S2【Master RCI!!】
https://www.gogojungle.co.jp/finance/navi/articles/93154
R1R2S2For the file names and titles of the PDFs to effectively utilize, please see the above Investment Navi+ article.
Below,mBDSR (RCI two-line filter)andR1R2S2examples showing signals simultaneously.
Dollar/Yen USDJPY 15-minute chart
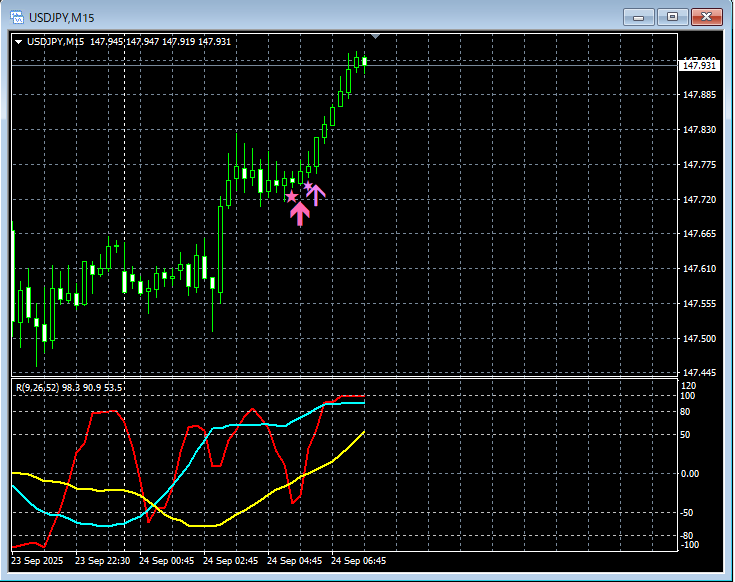
mBDSR (RCI two-line filter)andR1R2S2
In the above chart,signals of mBDSR (RCI two-line filter) and R1R2S2light up in a timely manner.
RCI three-lineis used to drill down from higher timeframes to lower timeframes,waiting for mBDSR signalsto light up,when the mBDSR signaldoes not light up, or when a signal is missed or late,R1R2S2 signalscan be used to respond,R1R2S2isoften used in conjunction withmBDSR
Indicators that shine when combined with RCI: 【BODSOR・mBDSR】
and methodology / case studies (PDF) ★GogoJungle AWARD 2020 Winner★
https://www.gogojungle.co.jp/tools/indicators/11836
Includes over 550 PDFs (methodology & case studies: over 1,950 pages, over 690,000 characters).
Most of them arecollections that logically link higher and lower timeframes using the RCI three-line to examine multiple lower-timeframe conditions sequentially, ultimately waiting for a dip buying or pullback selling timing (i.e., mBDSR signals) on the lower timeframe..
Also,many of them focus on capturing points where multiple entry justifications overlap..
Additionally,there are methods exploring ascent and decline targets using the RCI three-line..
In the PDF explanations,more than 1,900 chartsare used.

================================
Blacksun Indicators (List)
https://www.gogojungle.co.jp/finance/navi/articles/33779
================================
× ![]()


