

【RCI3 main line + mBDSR】USDCAD 4-hour chart pullback sell signal
BODSOR (mBDSR)The sales pageis here.
* BODSOR and mBDSR are indicators developed to improve entry accuracy when using three-line RSI to buy the dips or sell the rallies.
They help enhance entry precision for pullbacks and rejections.
The figure below is a 4-hour chart of USDCAD.
USDCAD 4-hour chart
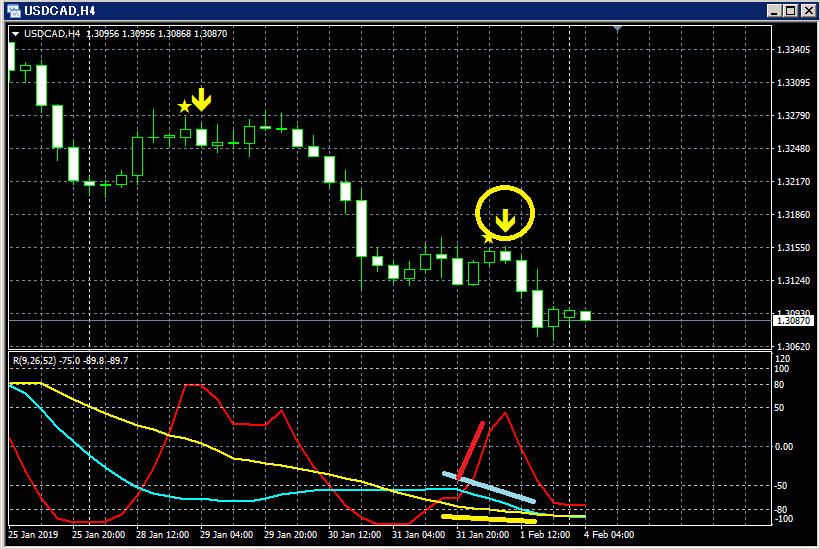
Upper: Section: mBDSR
Among the three RCI lines, only RCI9 is clearly rising.
If RCI9 reverses and heads down, all three RCIs may turn downward in this situation.
In other words, the price may undergo a strong decline.
In such a scenario, the mBDSR pullback sell signal (yellow arrow circled in a circle) lights up and
appears.
In this example, three bearish candles follow immediately after the pullback sell signal, indicating a well-timed continuation of the decline.
This appears to be a good timing capture for the downward move.
BODSOR (mBDSR) sales page ishere.

Twitter
https://twitter.com/RCIX3Line
Blog
http://bodsor.blog.fc2.com/
Investment Navigation Plus
https://fx-on.com/navi/serial/?id=359
YouTube
https://www.youtube.com/channel/UCL-g5uAlesiWVJEDtWlFvGw
Example of pullback buying and pullback selling signals on USD/JPY, 1-hour chart
* In the charts within this article, for convenience of explanation, there may be added circles, lines, and rectangles, so please understand.
.
× ![]()


