

Master RCI to the utmost!! Sign of R1R2S2 AUDUSD 15-minute chart
=================
[Ironclad Pattern] Signs of a rising high with Fibonacci, RCI oversold, and R1R2S2
USD/JPY 1-minute chart
https://www.gogojungle.co.jp/finance/navi/articles/97494
=================
Participating in the “Early Autumn Gogo Festival.”

[Mastering RCI!! Trend Reversal, Buy on Dips, Sell on Rallies]
Indicators that shine in combination with RCI: [BODSOR・mBDSR]
and methods / case studies (PDF) ★GogoJungle AWARD2020 winner★
https://www.gogojungle.co.jp/tools/indicators/11836
R1R2S2is included in the products above. For details, please see the following Investment Navi+ article.
RCI 3-line “Two-Stage Decision” to target trend reversals, buy on dips, and sell on rallies - the R1R2S2 release!!
*This product [BODSOR・mBDSR] includes 358 PDFs (over 1,400 pages in total, over 1,350 chart pages, over 470,000 characters) as part of the methods and case studies from before.
*In addition to the above PDFs, there are 31 PDFs (methods and case studies: over 120 pages, over 115 chart pages, over 40,000 characters) to effectively utilize R1R2S2.
PDF collection to effectively utilize R1R2S2 [Master RCI to Win!!]
https://www.gogojungle.co.jp/finance/navi/articles/93154
Please refer to the Investment Navi+ article above for the file names and titles of the PDFs to effectively utilize R1R2S2.
Below, we introduce examples of R1R2S2 signals.Australian Dollar / US Dollar AUDUSD 15-minute chart
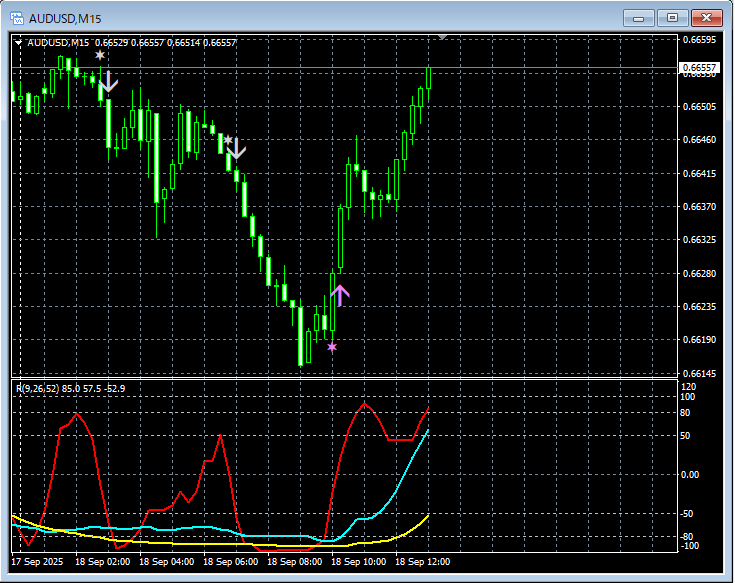
R1R2S2signals
On the above chart,R1R2S2 signalslight up at well-timed moments.
Waiting for mBDSR signalsandmBDSR signalsdid not light up, or were missed or lagged,R1R2S2 signalsmay be used to respond,R1R2S2isoften used in conjunction withmBDSR.
Indicators that shine in combination with RCI【BODSOR・mBDSR】
and methods / case studies (PDF) ★GogoJungle AWARD2020★
https://www.gogojungle.co.jp/tools/indicators/11836
Includes over 550 PDFs (methods and case studies: over 1,950 pages, over 690,000 characters).
Most of them are examples that break down the process of logically linking higher and lower timeframes using the RCI 3-line, and eventually waiting for dips or rallies on the lower timeframes (i.e., mBDSR signals).It is designed to analyze multiple lower-timeframe conditions sequentially.
Additionally,many materials focus on capturing points where multiple entry reasons coincide.Also included are methods to explore upside and downside targets using RCI 3-line.
In the PDF explanations,
are used.

=================
Blacksun’s Indicators (List)
https://www.gogojungle.co.jp/finance/navi/articles/33779
=================


