

【Master RCI to Win!!】R1R2S2 Signal for AUD/JPY 5-minute chart
===============================
[Iron-clad Pattern] Signals of decline from recent highs with Fibonacci, RCI oversold, and R1R2S2
USD/JPY 1-minute chart
https://www.gogojungle.co.jp/finance/navi/articles/97494
===============================
Participating in the “Early Autumn GogoToku Festival.”

【Mastering RCI!! Trend Reversal, Buying on Dips, Selling on Rises】
Indicators that shine when combined with RCI:【BODSOR・mBDSR】
and methods / case studies (PDF) ★GogoJungle AWARD 2020 Recipient★
https://www.gogojungle.co.jp/tools/indicators/11836
R1R2S2is included in the above products. For details, please read the Investment Navi+ article below.
RCI 3-line “two-stage judgment” to target trend reversals, dips, and rallies: R1R2S2 released!!
※ This product【BODSOR・mBDSR】comes with a traditional PDF set (as method & case studies) totaling 358 files (over 1,400 pages, more than 1,350 charts, over 470,000 words).
※ In addition, separately from the above PDFs, there are 31 PDFs (methods & case studies: over 120 pages, more than 115 charts, over 40,000 words) to effectively utilize R1R2S2.
PDF collection to effectively utilize R1R2S2【Master RCI and Win!!】
https://www.gogojungle.co.jp/finance/navi/articles/93154
For the file names and titles of the PDFs to effectively utilize R1R2S2, please refer to the above Investment Navi+ article.
Below, we introduce some examples of R1R2S2 signals.AUD/JPY 5-minute chart
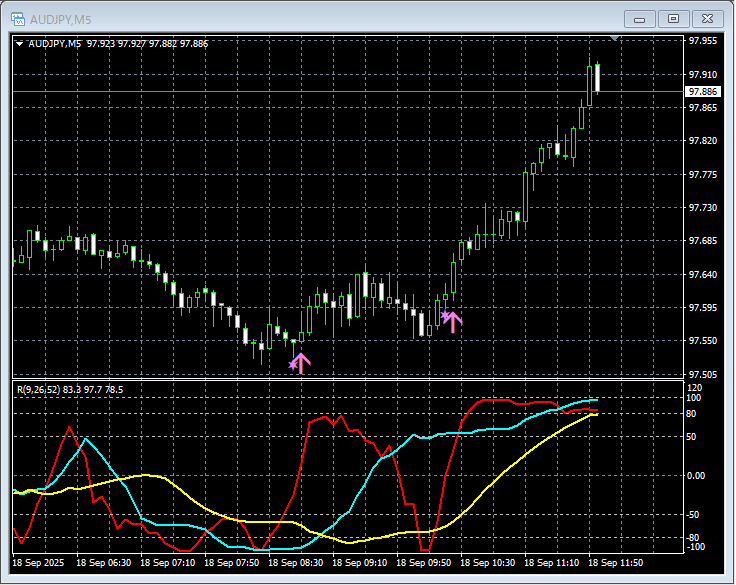
R1R2S2signals
In the chart above,R1R2S2 signalslight up at well-timed moments.
Waiting for mBDSR signals,mBDSR signalsdid not light up, or were missed or late,R1R2S2 signalscan respond, andR1R2S2is often used in conjunction withmBDSR.
Indicators that shine when combined with RCI【BODSOR・mBDSR】
and methods / case studies (PDF) ★GogoJungle AWARD 2020★
https://www.gogojungle.co.jp/tools/indicators/11836
Comes with over 550 PDF files (methods & case studies: over 1,950 pages, over 690,000 words).
Many of these are built by using the three RCI lines to logically link higher and lower timeframes, then sequentially analyze multiple lower-timeframe conditions, ultimately waiting for dips or rallies (i.e., mBDSR signals) on the lower timeframe.
Also,there are many that emphasize identifying points where multiple entry rationales overlap..
Additionally,there are methods that explore upside and downside targets using the three RCI lines..
In the PDF explanations,over 1,900 charts are used.

===============================
Blacksun’s Indicators (List)
https://www.gogojungle.co.jp/finance/navi/articles/33779
===============================


