

【RCI3 One Line + BODSOR】Bitcoin Yen 4-hour chart Retrace Sell Signal
※BODSOR is an indicator developed to improve entry accuracy when buying on pullbacks or selling on rallies using the RCI three-line method.
RCI Three-Line and BODSOR usage examples
One of the features of the RCI three-line (RCI9, RCI26, RCI52) is
“When all three RCIs point in the same direction, the price movement in that direction tends to be stronger.”
If RCI26 and RCI52 are rising (or falling) and RCI9 is falling (or rising),
and RCI9 reverses,“All three RCIs will be aligned in the same direction.”
Therefore, detecting when RCI9 will reverse is extremely important.
(Case by case, simply waiting for a confirmed reversal of RCI9 often results in significant late entries.)
Hence, BODSOR was developed to detect as early as possible the timing when the momentum of RCI9 to rise (or fall) becomes weak
.
The figure below is the Bitcoin/Japanese Yen 4-hour chart.
Bitcoin/Japanese Yen 4-hour chart
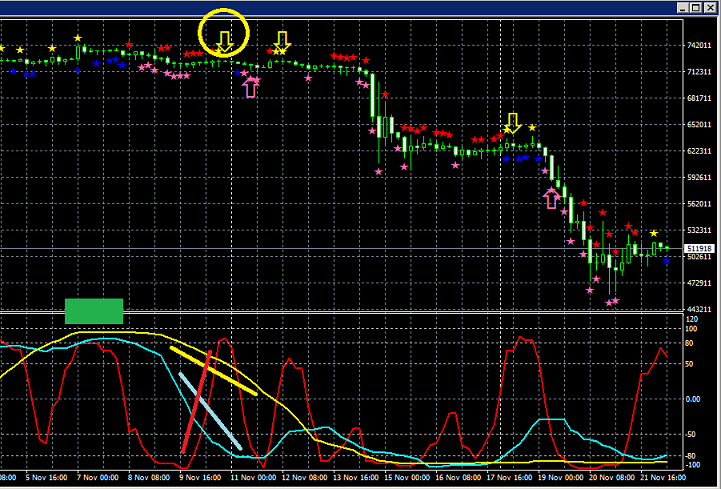
Top: BODSOR
Bottom: RCI Three-Line (Red: RCI9, Light blue: RCI26, Yellow: RCI52)
Among the three RCI lines, only RCI9 is clearly rising.
If RCI9 reverses downward, all three RCIs may move downward together.
In other words, the price could undergo a strong drop.
In such a situation,the return-sell signal of BODSOR (yellow arrows) lights up.
After the signal lights, the price declines smoothly.
This indicator was developed to improve entry accuracy when using the RCI three-line method for buying on dips or selling on rallies
.

RCI Three-Line and BODSOR usage examples
One of the features of the RCI three-line (RCI9, RCI26, RCI52) is
“When all three RCIs point in the same direction, the price movement in that direction tends to be stronger.”
If RCI26 and RCI52 are rising (or falling) and RCI9 is falling (or rising),
and RCI9 reverses,“All three RCIs will be aligned in the same direction.”
Therefore, detecting when RCI9 will reverse is extremely important.
(Case by case, simply waiting for a confirmed reversal of RCI9 often results in significant late entries.)
Hence, BODSOR was developed to detect as early as possible the timing when the momentum of RCI9 to rise (or fall) becomes weak
.
The figure below is the Bitcoin/Japanese Yen 4-hour chart.
Bitcoin/Japanese Yen 4-hour chart
Top: BODSOR
Bottom: RCI Three-Line (Red: RCI9, Light blue: RCI26, Yellow: RCI52)
Among the three RCI lines, only RCI9 is clearly rising.
If RCI9 reverses downward, all three RCIs may move downward together.
In other words, the price could undergo a strong drop.
In such a situation,the return-sell signal of BODSOR (yellow arrows) lights up.
After the signal lights, the price declines smoothly.
This indicator was developed to improve entry accuracy when using the RCI three-line method for buying on dips or selling on rallies
.
https://twitter.com/RCIX3Line
Blog
http://bodsor.blog.fc2.com/
Investor Navi+
https://fx-on.com/navi/serial/?id=359
YouTube
https://www.youtube.com/channel/UCL-g5uAlesiWVJEDtWlFvGw
Examples of pullback buying and rally selling signals on USD/JPY 1-hour chart
※In the charts within this article, for clarity, there may be additions such as yen marks, straight lines, or rectangles, so please understand.
。
(Please rewrite this part when publishing to buyers)
× ![]()


