

【RCI3 single line + BODSOR】AUDUSD 1-hour chart pullback buy signal
※BODSOR is an indicator developed to improve the entry accuracy when buying on pullbacks or selling on rallies using the RCI three-line system.
RCI three-line and BODSOR usage examples
One of the characteristics of the RCI three-line (RCI9, RCI26, RCI52) is
“When all three RCI lines align in the same direction, the price movement in that direction tends to be larger.”
When RCI26 and RCI52 are rising (or falling) and RCI9 is falling (or rising),
if RCI9 reverses“All three RCIs align in the same direction.”this becomes the case.
Therefore, anticipating when RCI9 will reverse becomes extremely important.
(In some cases, waiting for a simple confirmation of RCI9 reversal can lead to significant delays.)
Hence, to detect as early as possible the timing when RCI9’s upward (downward) momentum weakens
, BODSOR was developed.
The figure below is a chart of AUDUSD on a 1-hour timeframe.
AUDUSD 1-hour chart (November 21, 2018)
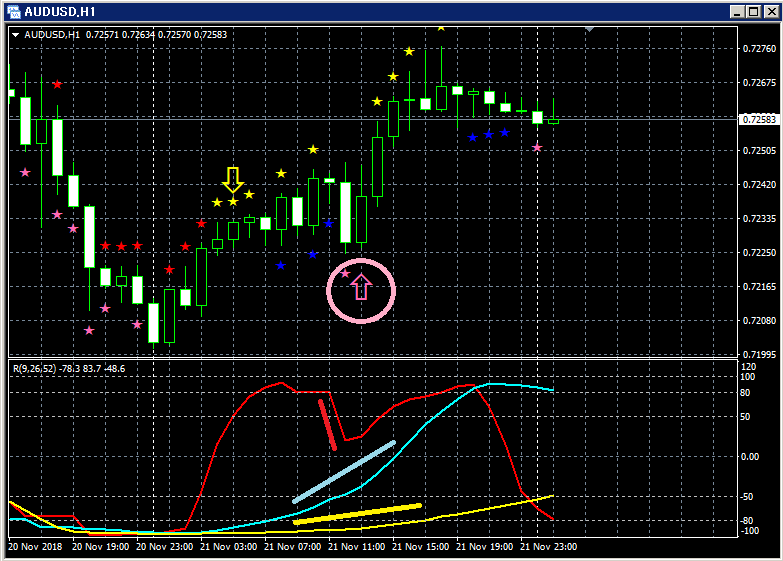
Upper section:BODSOR
Lower section: RCI three-lines (red: RCI9, light blue: RCI26, yellow: RCI52)
Pullback buying signal (pink arrow circled)
Among the three RCI lines, only RCI9 is clearly declining.
In such a situation,BODSORpullback buying signal (pink arrow) lights up.
From right after the signal appears, the price clearly climbs.

Twitter
https://twitter.com/RCIX3Line
Blog
Investment Navi+
https://fx-on.com/navi/serial/?id=359
YouTube
https://www.youtube.com/channel/UCL-g5uAlesiWVJEDtWlFvGw
Examples of pullback buy and retracement sell signals on USD/JPY 1-hour chart
※Note that for readability in this article, some charts may include additions such as circles, lines, or rectangles drawn for explanatory purposes, so please understand.


