

[RCI3 Three-line plus BODSOR] NZDUSD 5-minute chart pullback sell signal 20181119
※BODSOR is an indicator developed to improve the entry precision when using three-line RCI (RCI3) for buy-the-dip or sell-the-rally strategies.
RCI 3-lineandBODSOR usage examples
One of the features of the RCI3 lines (RCI9, RCI26, RCI52) is
“When all three RCIs are aligned in the same direction, the price movement in that direction tends to be stronger.”
This is one of the characteristics.
If RCI26 and RCI52 are rising (falling) while RCI9 is falling (rising),
when RCI9 reverses,“All three RCIs are aligned in the same direction.”This is what happens.
Therefore, detecting when RCI9 will reverse is very important.
(Case by case, but simply waiting for a confirmed reversal of RCI9 often results in significant lag.)
Hence, BODSOR was developed to detect as early as possible the timing when the momentum of RCI9 to rise (or fall) is weakening.
The figure below is a 5-minute chart of NZDUSD.
NZDUSD 5-minute chart (November 19, 2018)
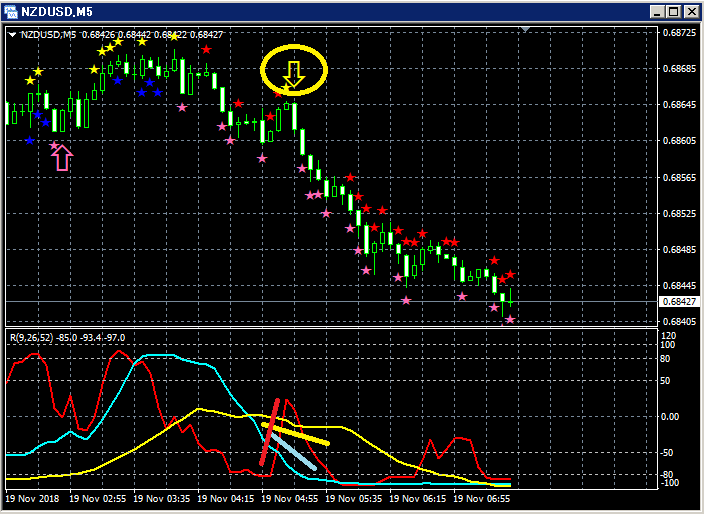
Top: BODSOR
Bottom: RCI3-lines (red: RCI9, light blue: RCI26, yellow: RCI52)
Among the RCI3-lines, only RCI9 is clearly rising.
If RCI9 reverses downward, all three RCIs may align to decline.
In other words, price may exhibit a strong fall.
In such a situation,BODSOR’s sell-on-rally signal (yellow arrow) lights up.
Immediately after the signal, a sequence of five bearish candles appears, and the price declines steadily.
In using the RCI3-lines for buying on dips or selling on rallies,
this indicator was developed to improve entry accuracy.
Twitter
https://twitter.com/RCIX3Line
Blog
http://bodsor.blog.fc2.com/
Investment Navigator+
https://fx-on.com/navi/serial/?id=359
YouTube
https://www.youtube.com/channel/UCL-g5uAlesiWVJEDtWlFvGw
Examples of Buy-the-dip/Sell-the-rally signals on the USD/JPY 1-hour chart
※In the charts in this article, for ease of explanation, circles, straight lines, and boxes may be drawn, so please forgive.


