EA Craftsman’s EA Course [005] Techniques to Create the Holy Grail EA / The Trap of Over-Optimization (Curve Fitting, Overfitting)
Over-Optimization
We lightly touched on over-optimization in the third lecture, but this time I would like to deepen it by putting it into practice.Before that, a quick recap of the third session: what is over-optimization…

A logic that trades with a large number of parameters, indicators, and conditions tends to have a low likelihood of the same conditions occurring in the future, resulting in low backtesting reproducibility.
Seeing is believing, so I’ll actually operate MT4 and show you.
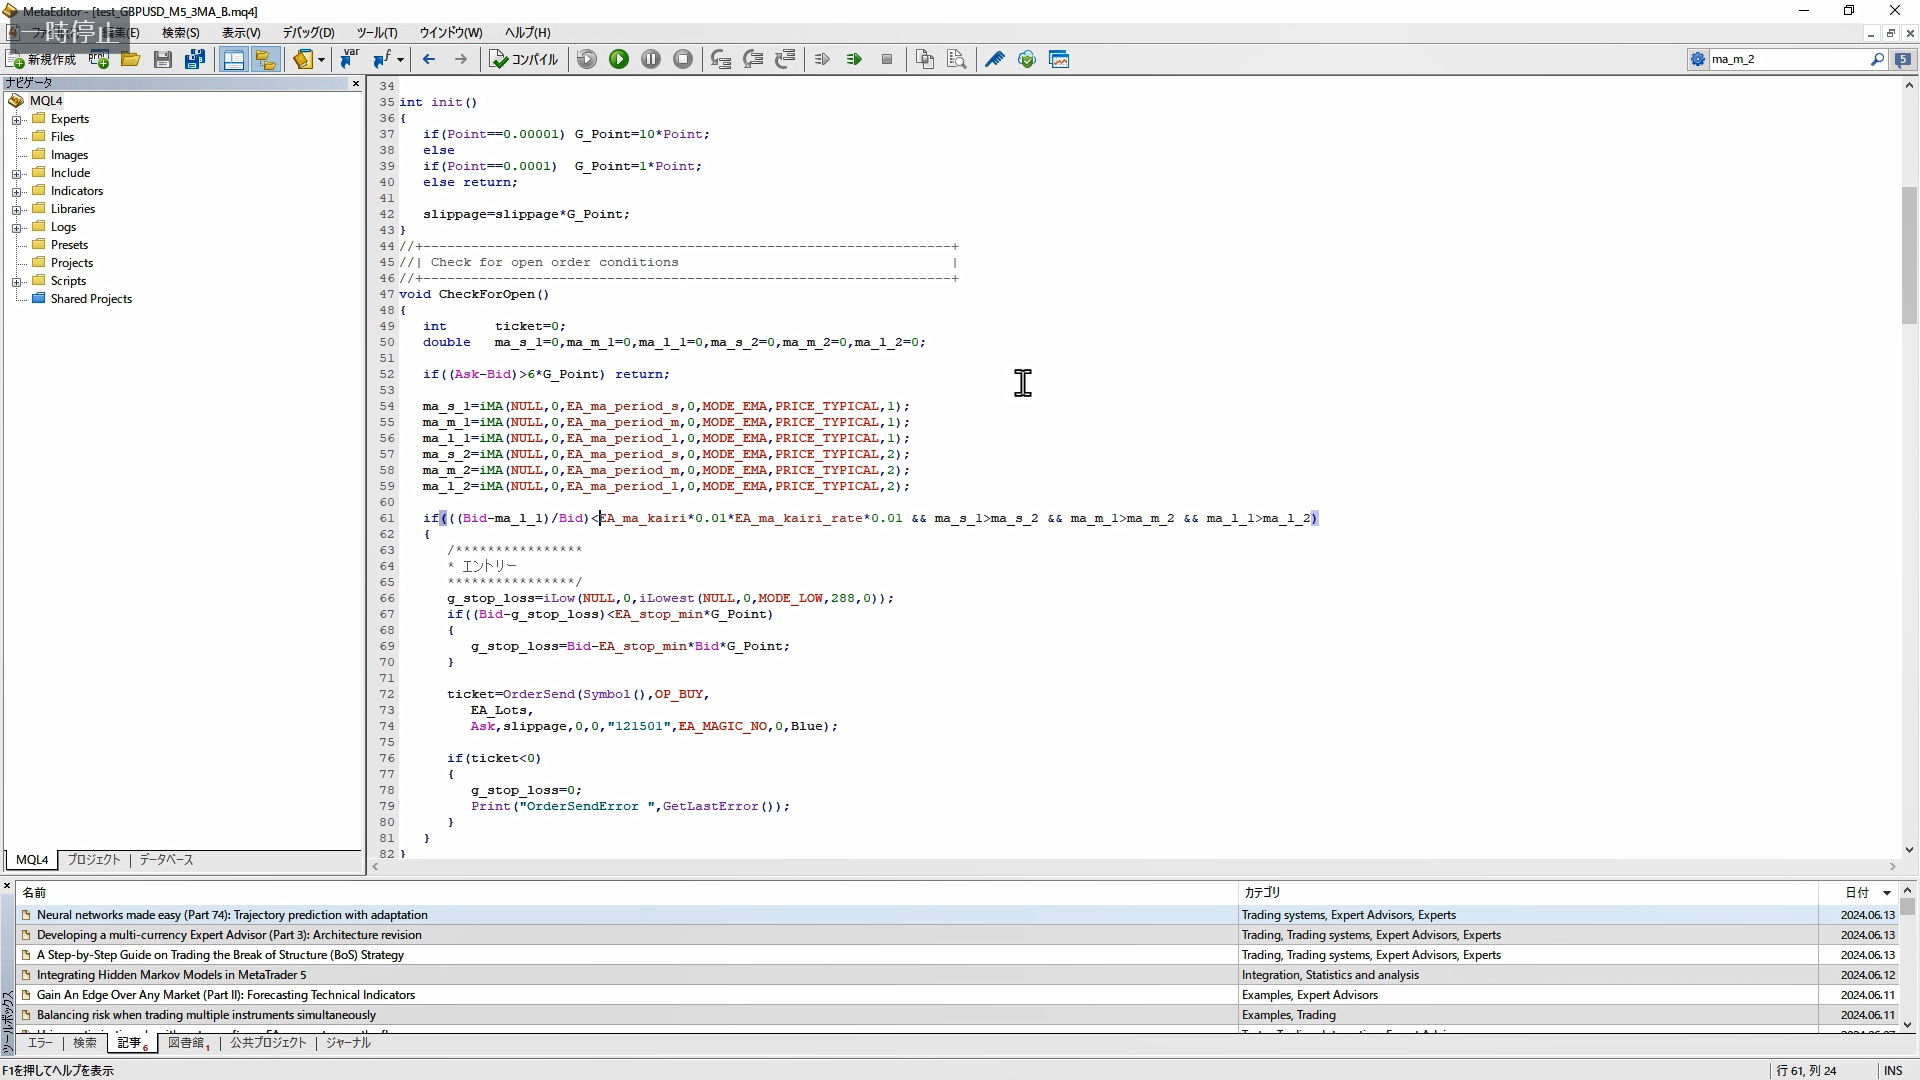
This is an EA I created hastily for this explanation. It runs on the 5-minute chart of GBPUSD.
To put the logic simply, when the rate is not deviating upward beyond the long-term moving average, and all moving averages—long, medium, and short—all point upward, then go long.
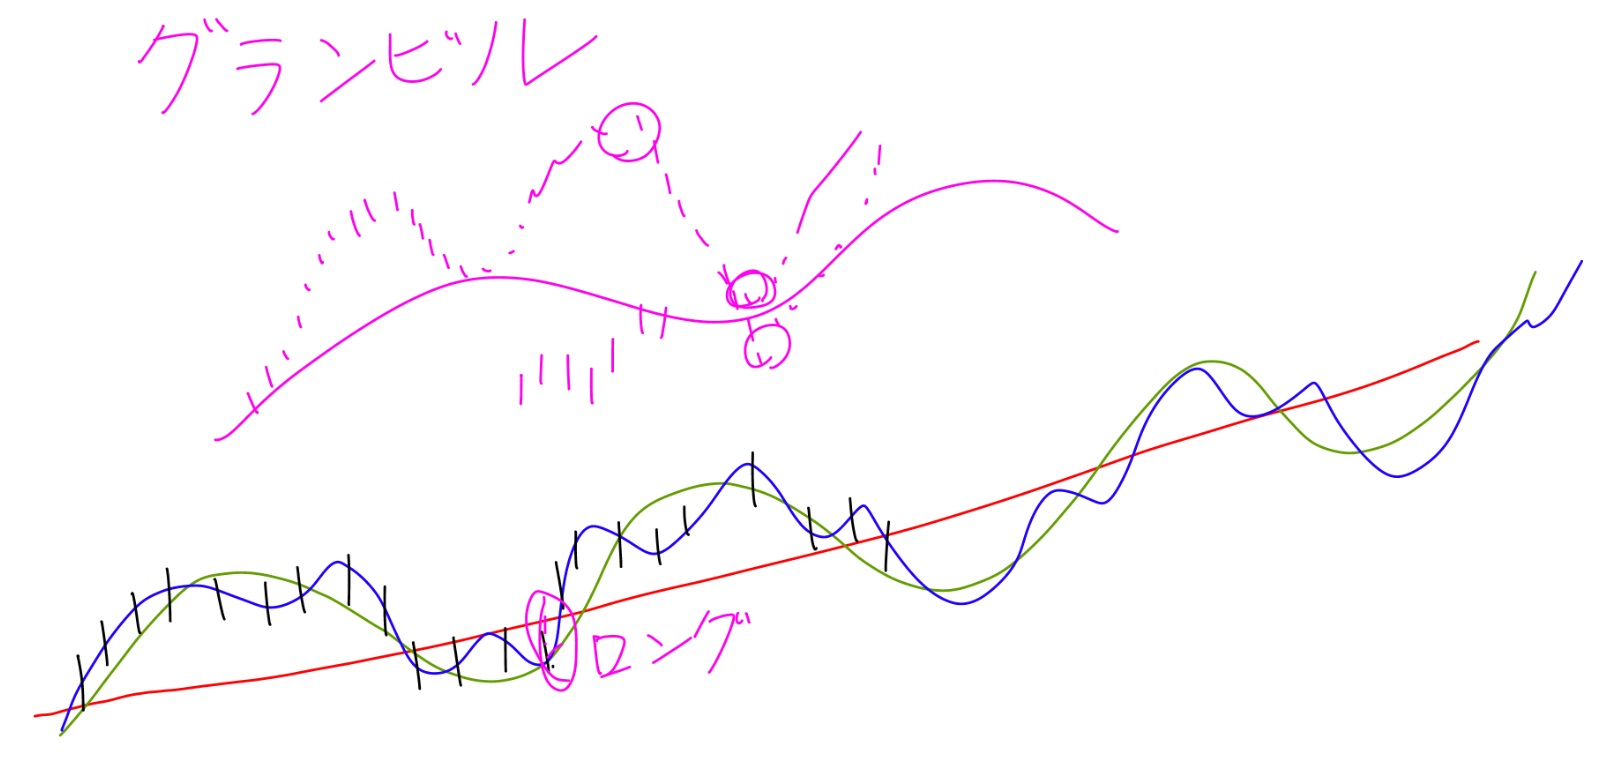
It’s a logic somewhat modified from the so-called Grandville’s law.
After entry, it is closed by a trailing stop. To simplify processing, I made it logic that only goes long.
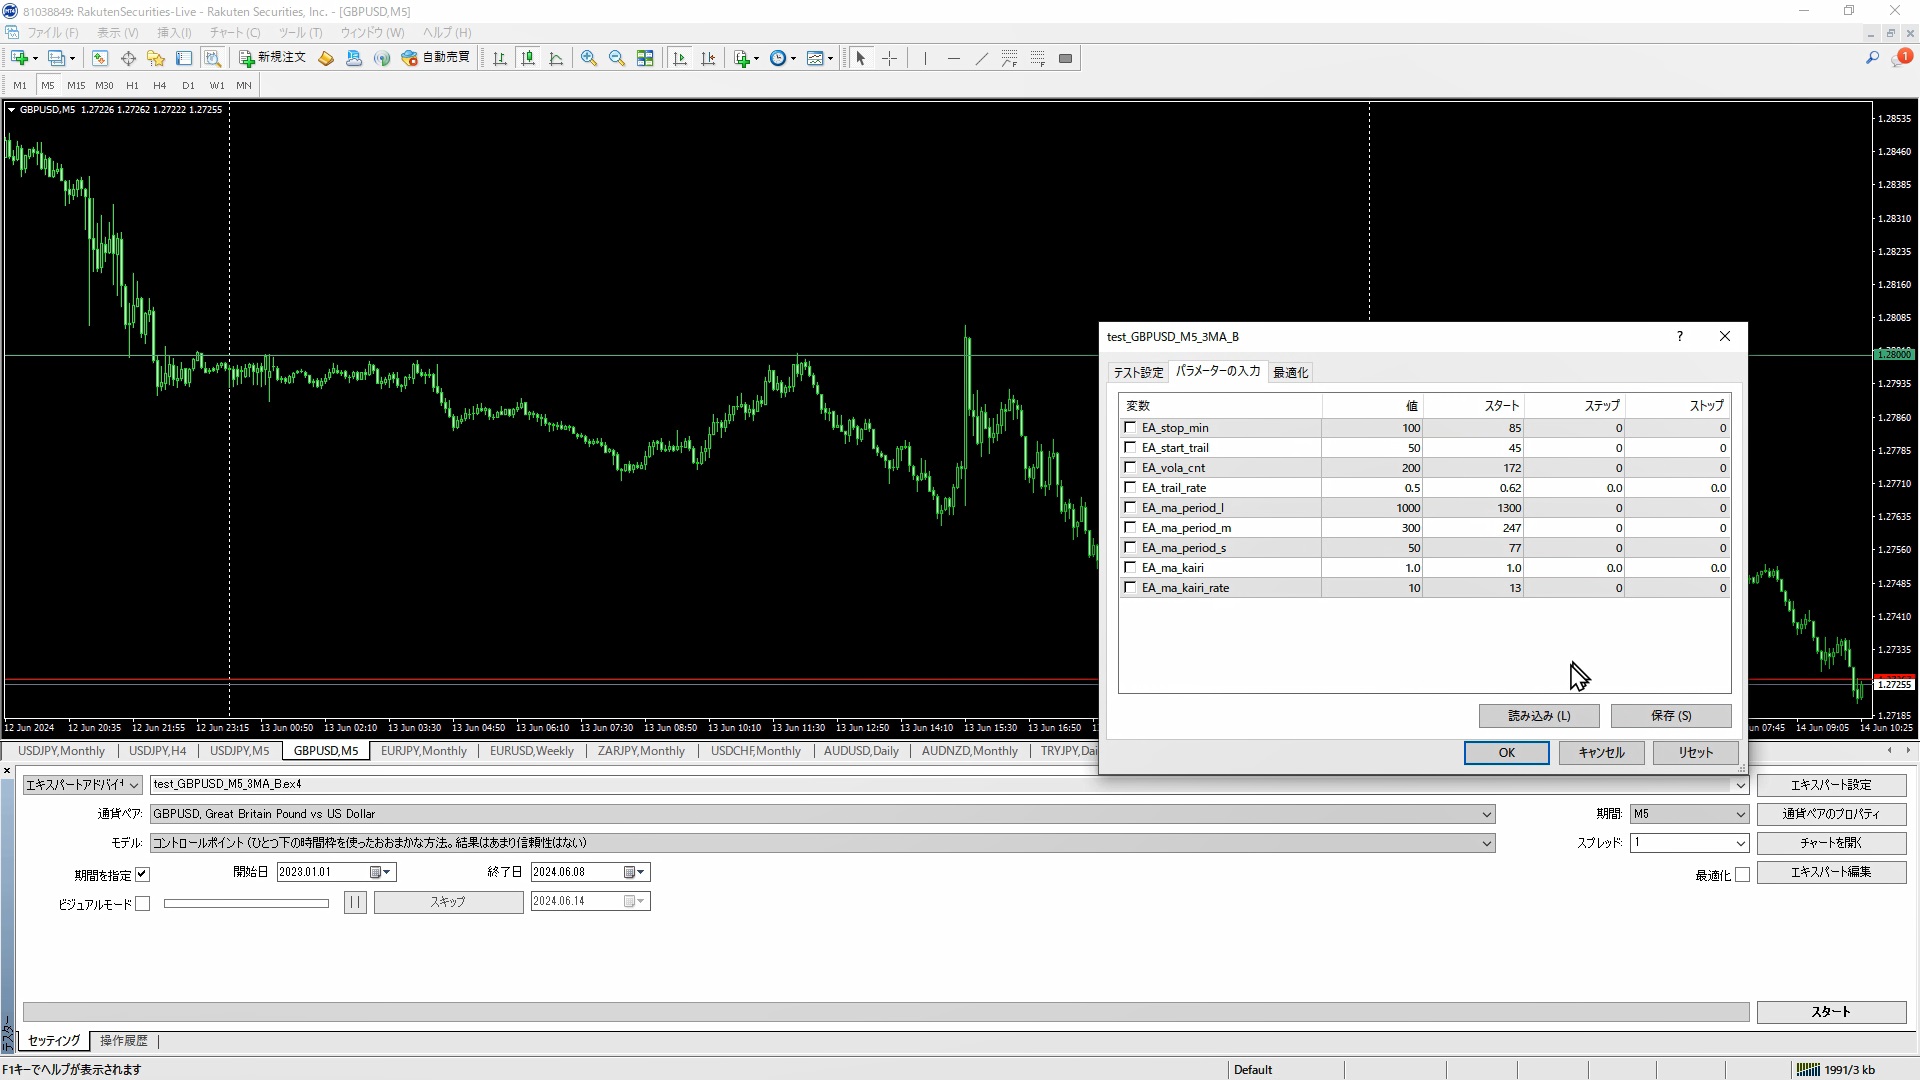
The parameters look like this. We will optimize these parameters from here. The optimization method is explained in detail in the video.
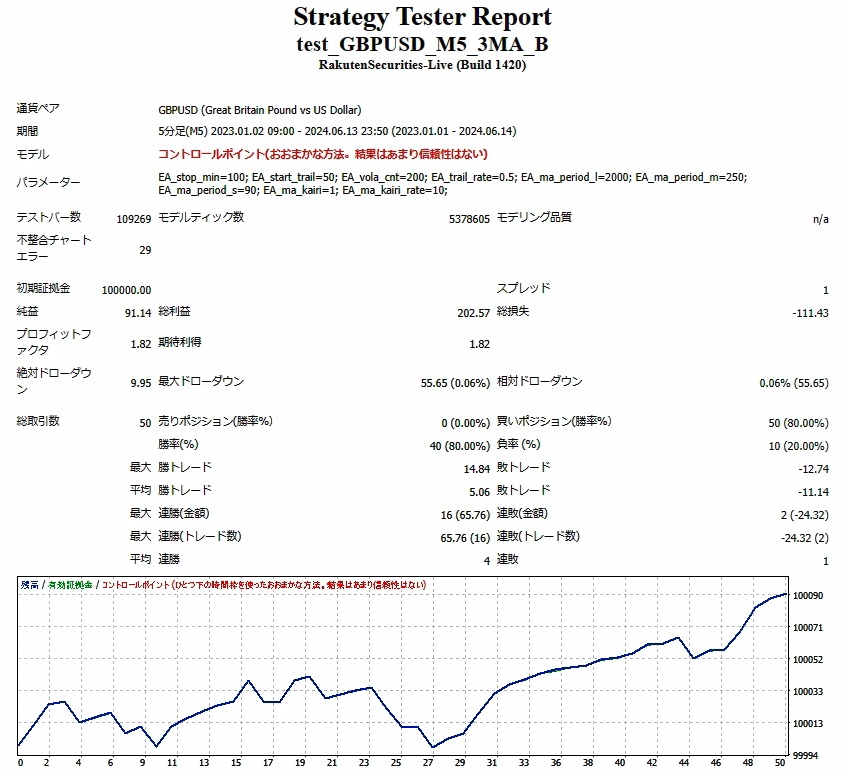
Now, let’s first check the performance in the state before optimization with a backtest.
The backtest period was from January 1, 2023 to today (June 14, 2024).
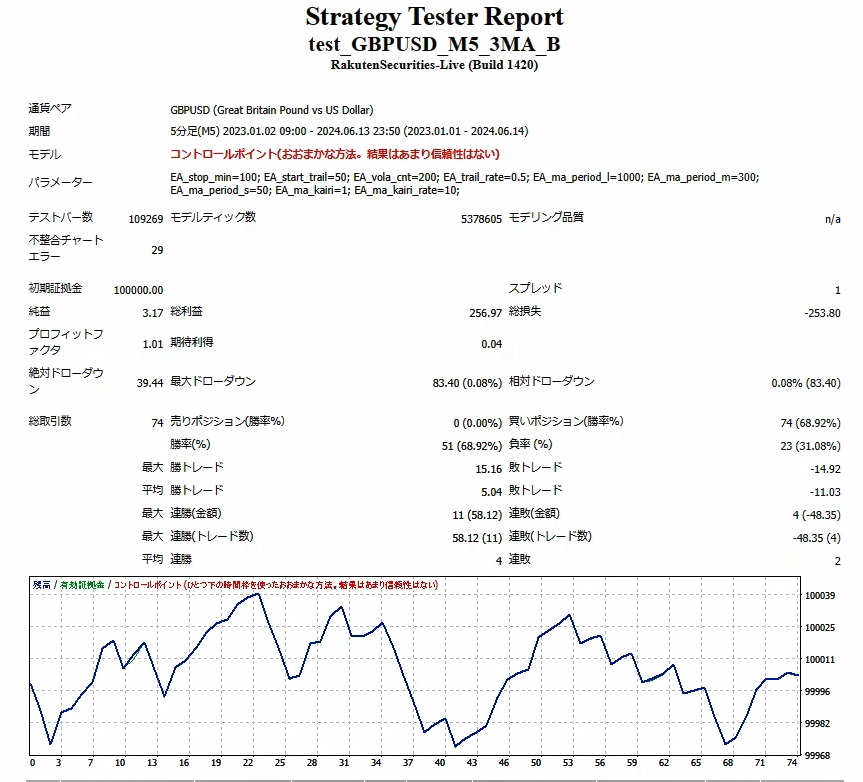
PF (Profit Factor) 1.01… there are no losses, but at this level it’s not usable.
Next, I’d like to optimize the moving average group first. Optimization means running backtests while changing parameters and searching for combinations with good results.
Decide the range of parameters you want to test, check the [Optimize] checkbox, and start.
Then the results for each combination will be displayed in a list, and you can adopt the parameters you like from among them.
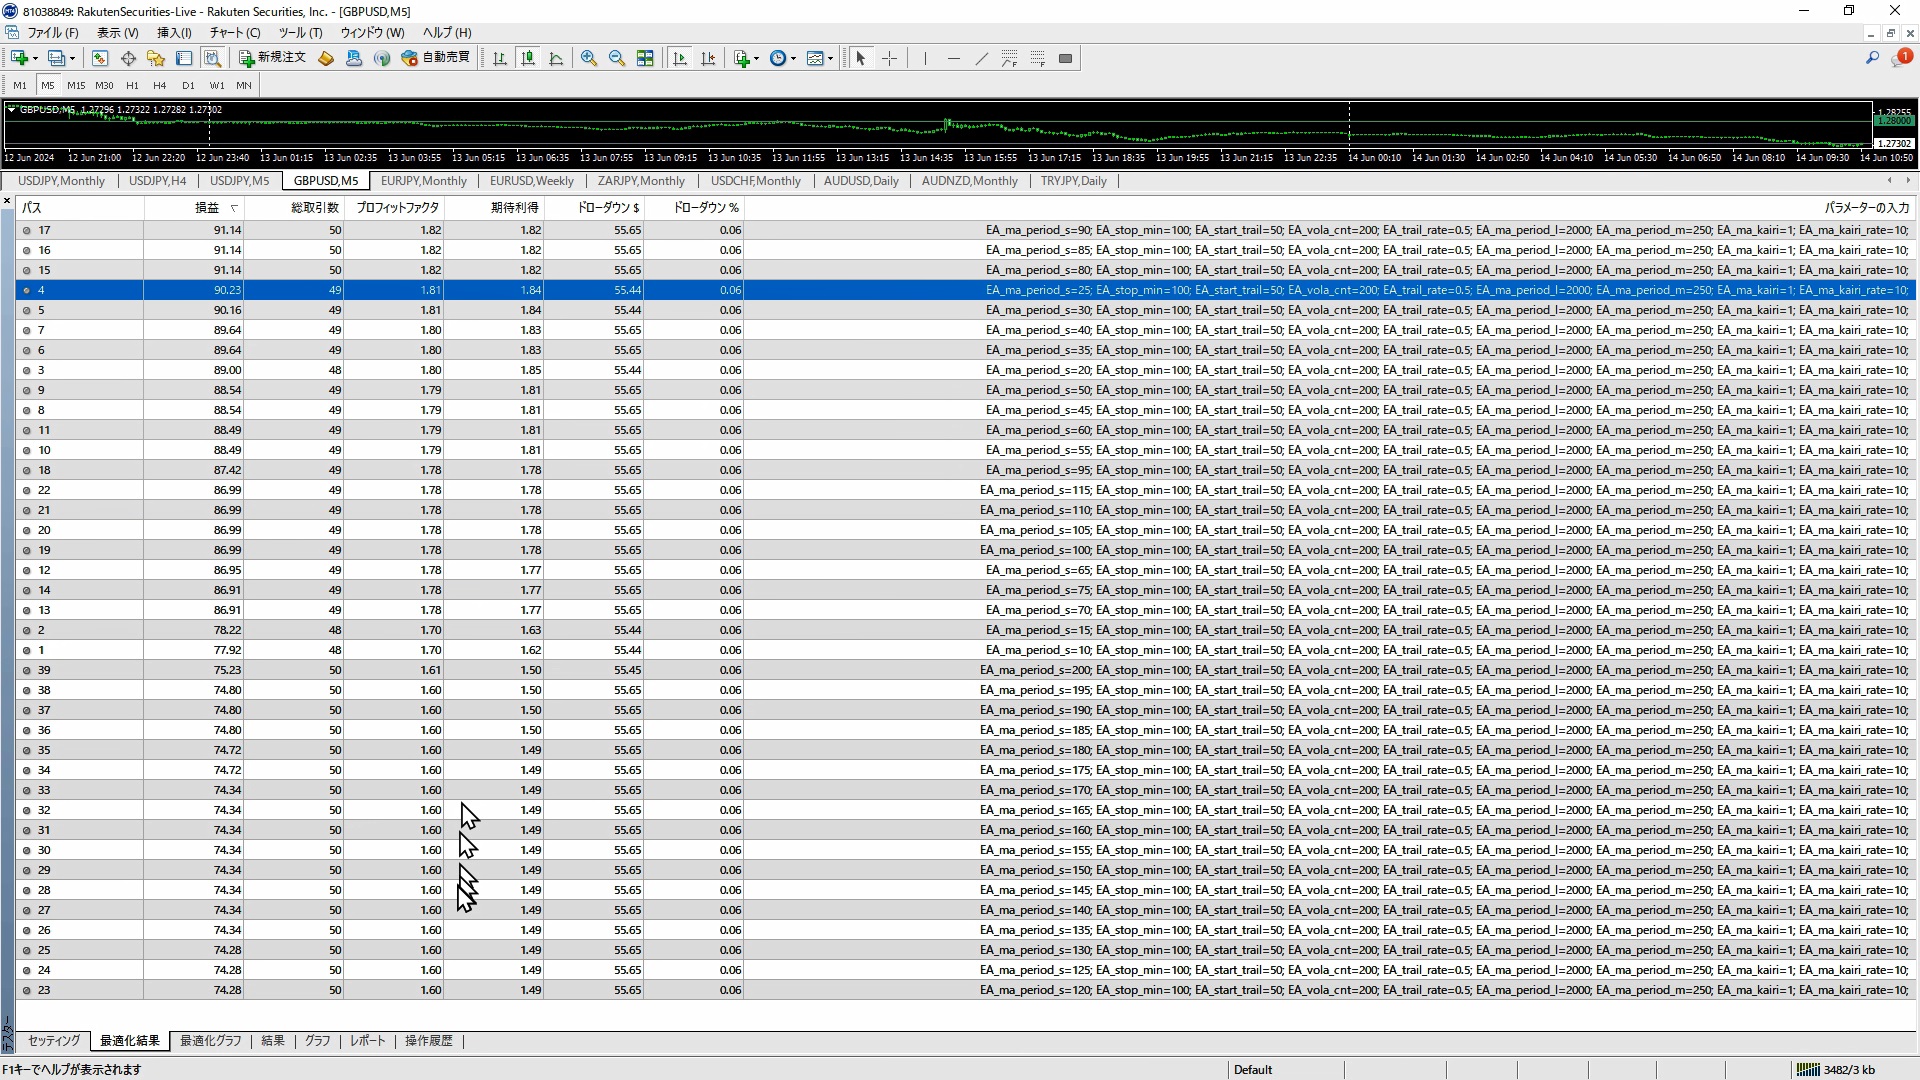
With those parameters, run backtests again and you’ll see results like the following, which are much better than the initial ones.
In this way, I will optimize other parameters as well.
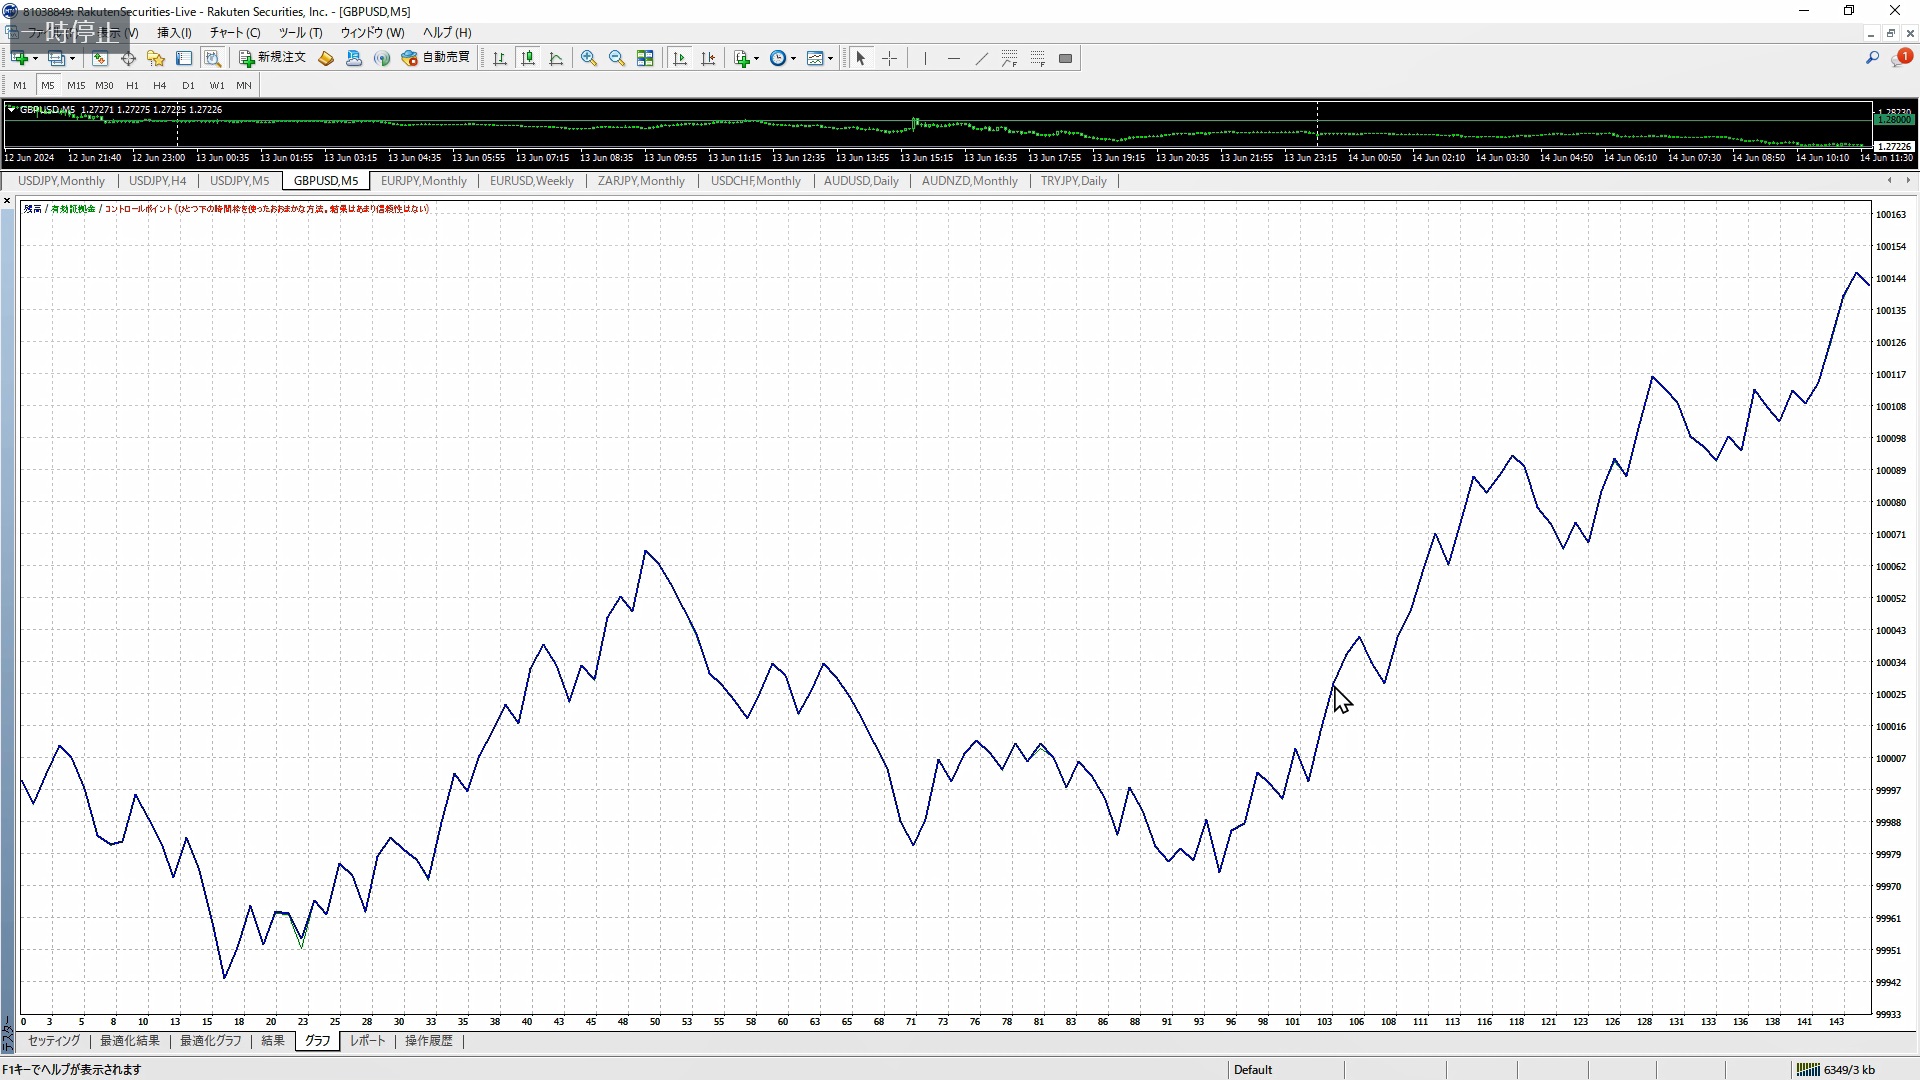
This is the equity curve after optimizing all parameters.
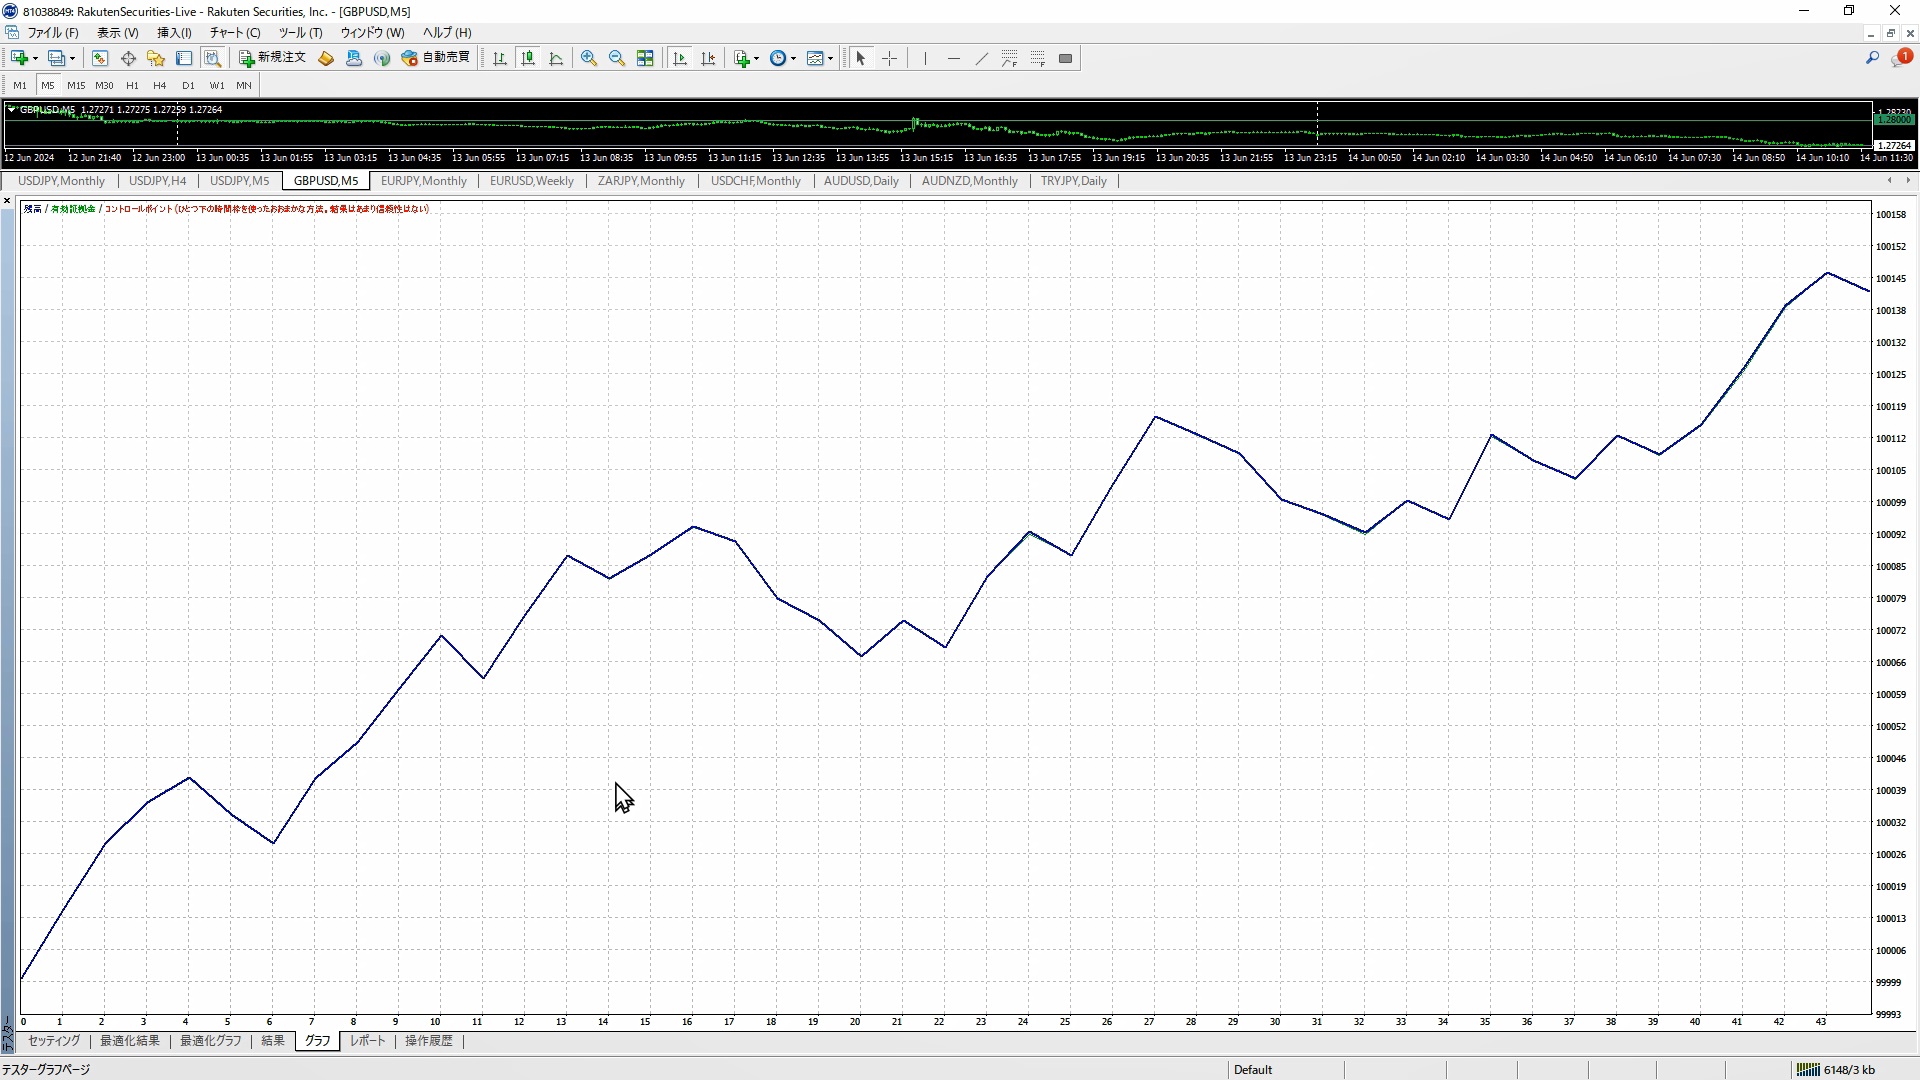
There are some drawdowns, but basically it’s an upward trend, so you might think, ‘I can operate this.’
Now, next, let’s change the backtest period and try again.
Until now, I’ve used data from January 1, 2023 to today, so I’ll try with data from January 1, 2020 to December 31, 2022.
As you can see, it’s again a drawdown-free but not very desirable equity curve.
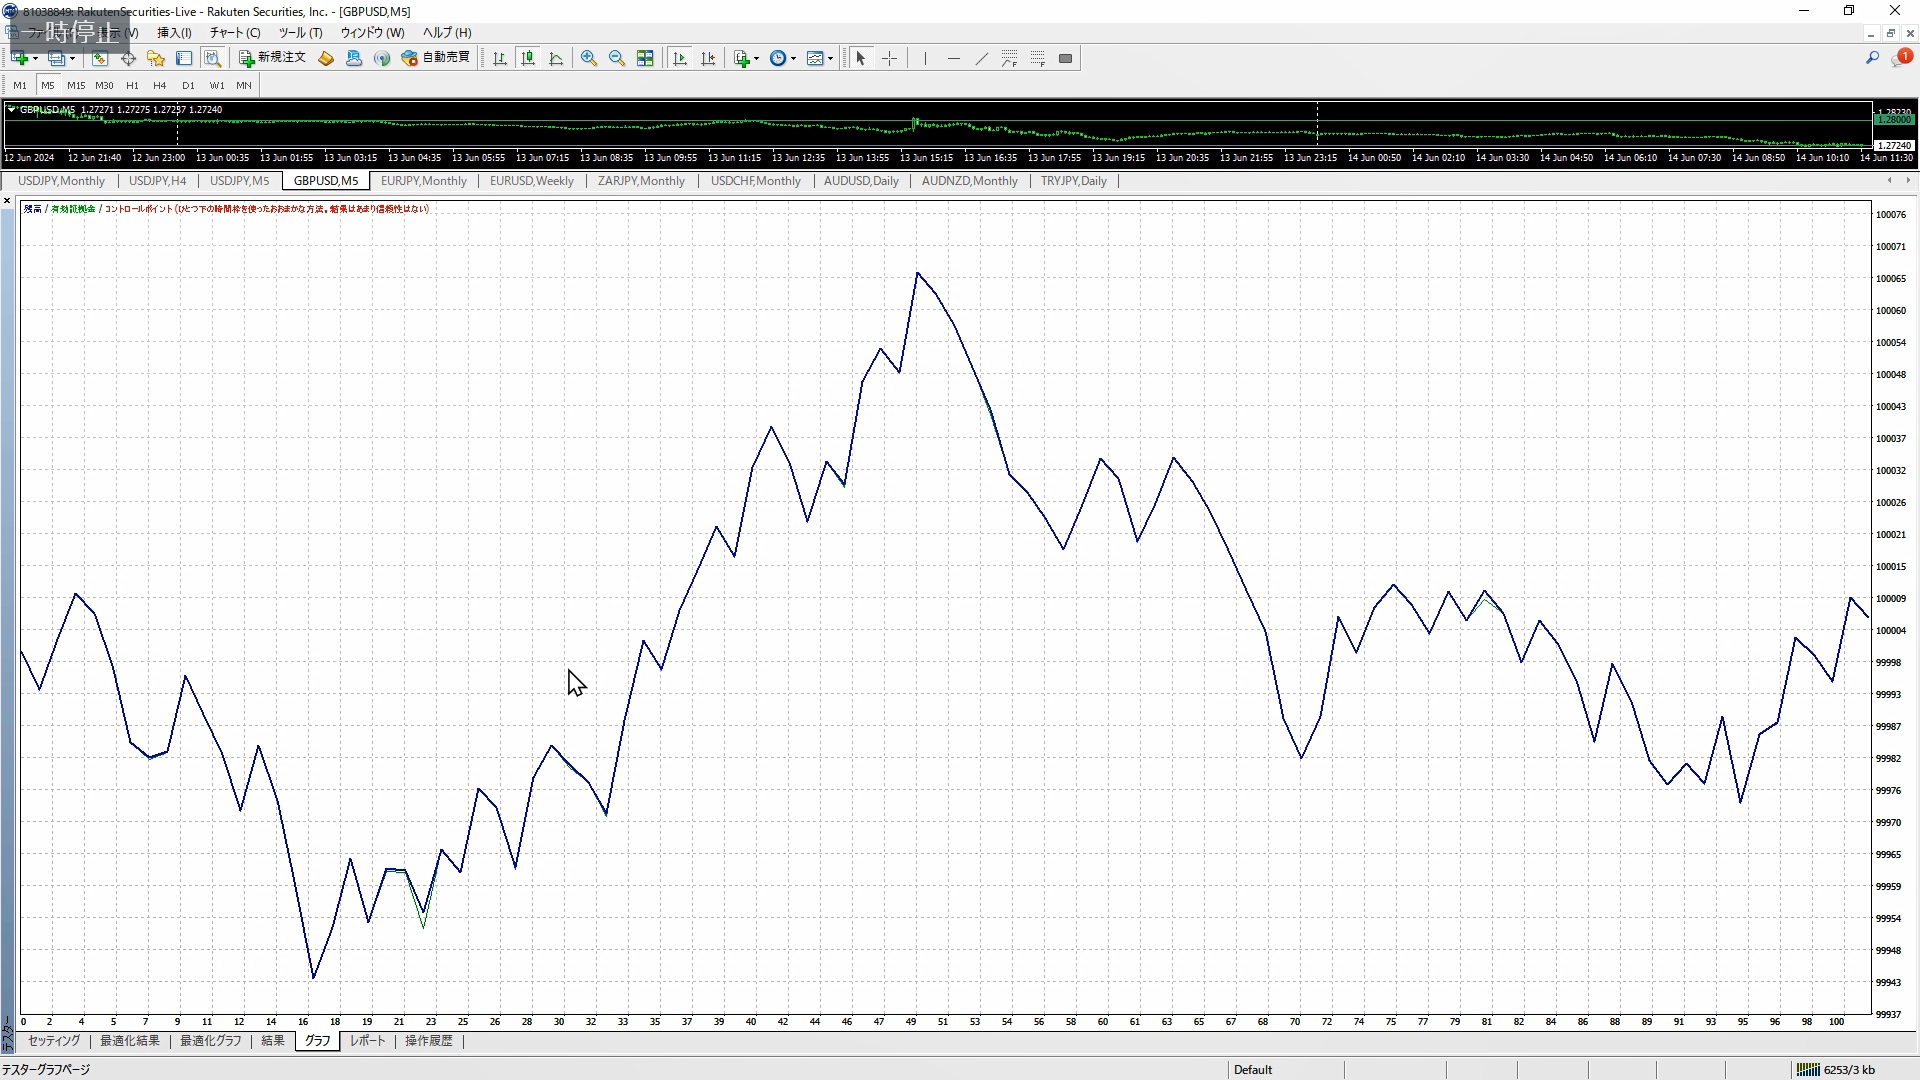
If I test from January 1, 2020 to today, it looks like this. From October 2022 onward it rises, but before that it’s marginal.
So, what should we do about the parts of this equity curve that we don’t like, namely the drawdowns?
You know what to do. Do more optimization and look for combinations with smaller drawdowns.
If you still aren’t satisfied with the equity curve, increase the number or type of indicators or add conditions to the trades you don’t like to stop them from being executed.
But would you want to use an EA developed in this way?
It’s not that the edge is yielding profits in backtests; it’s simply that bad trades are being eliminated by adding indicators or conditions.
This is the true nature of over-optimization.
That’s why reproducibility is low. That’s why performance can suddenly deteriorate in forward testing.
Like bridges and buildings, even if they look plain, simple structures are sturdy. Extravagant designs tend to be fragile.
Similarly, appliances with many functions like “when will I ever use this?” tend to break more easily.
The same is true for EAs.
As discussed in the third lecture, the ideal is
- few indicators
- few parameters
- long-term backtesting
- simple
- easy to understand
Since it’s impossible to satisfy everything perfectly, the idea is to choose a well-balanced EA while being mindful of these items and incorporate it into a portfolio to achieve stable income in FX.
■ My developed EA concept and operating policy
EA Artisan’s EA (Three Arrows) is here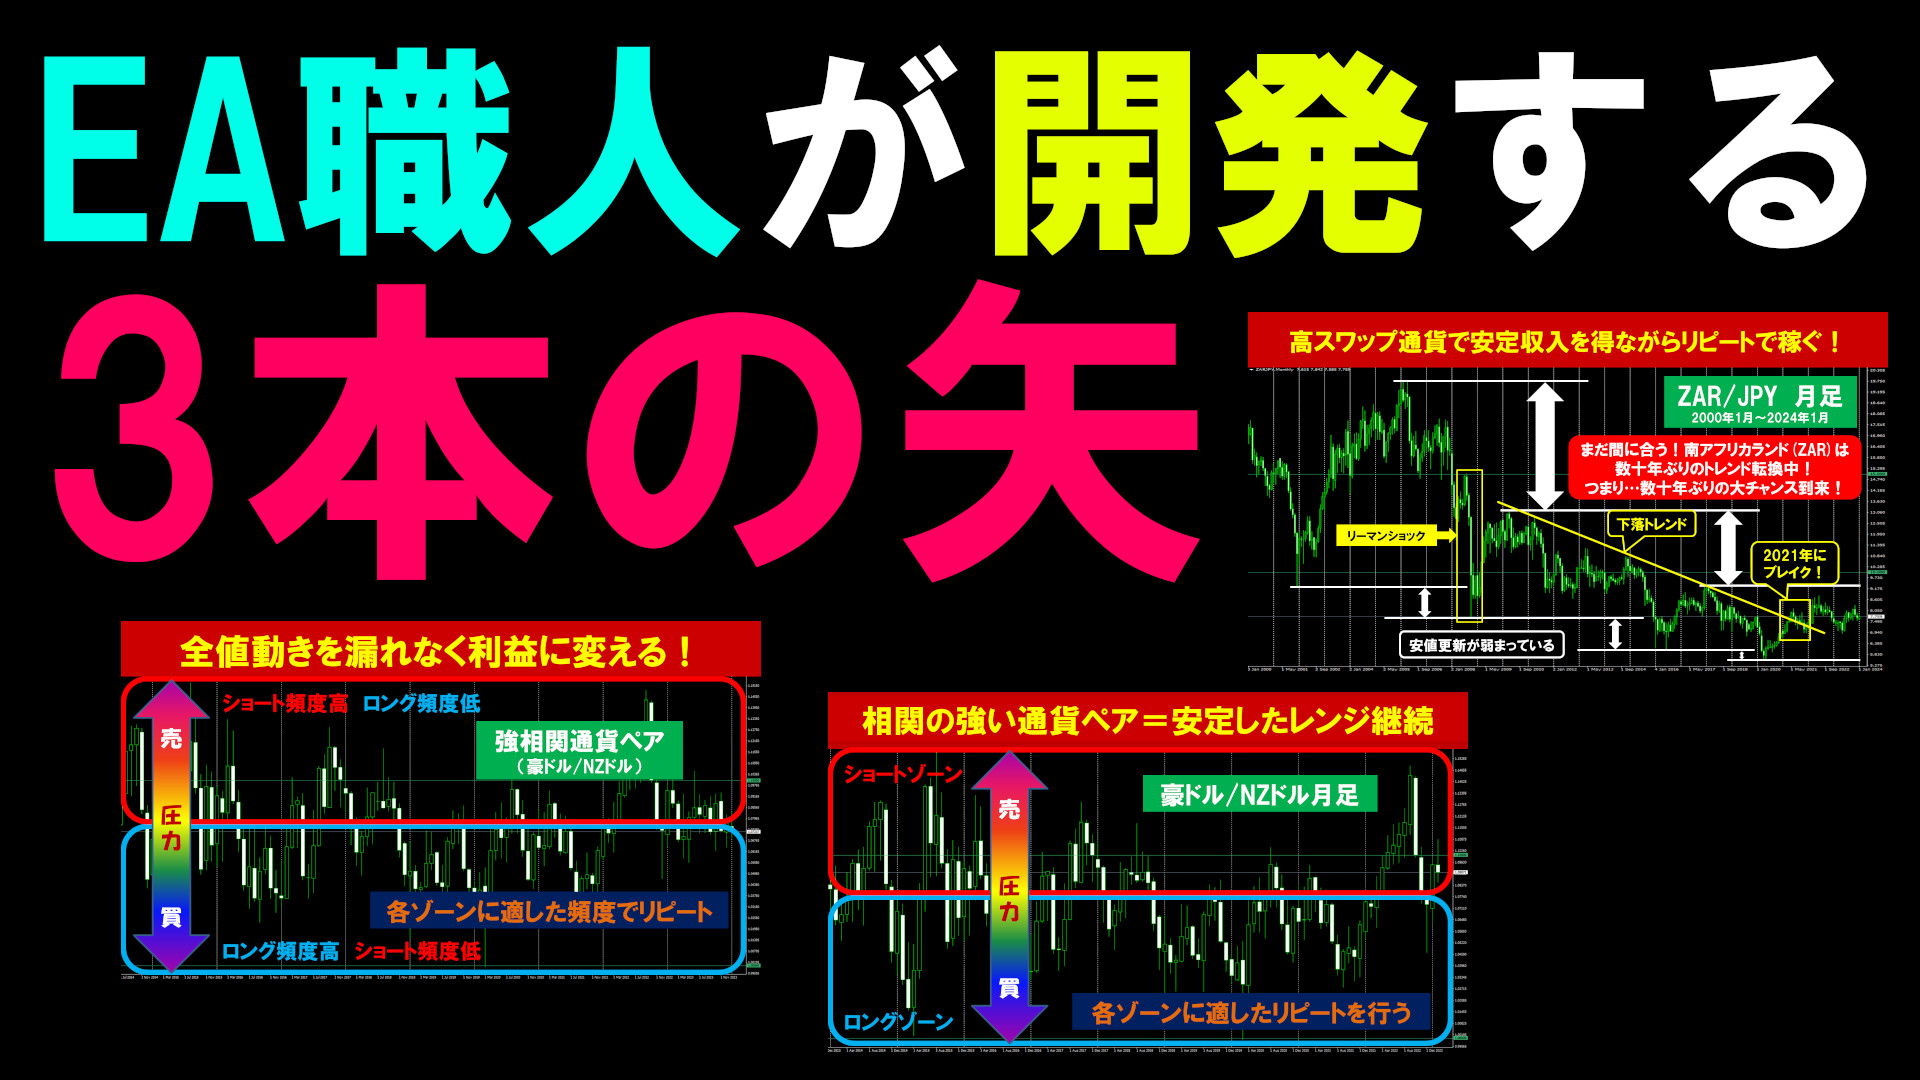
× ![]()