

RCI3 Ceiling and RCI3 Valley Bottom and BODSOR
BODSOR: An indicator developed to improve entry precision when applying pullback buying or pullback selling using the RCI3 line
Examples of Using RCI3 Lines and BODSOR
The figure below is a 5-minute chart of GBPUSD.
GBPUSD 5-minute chart (September 20, 2018)
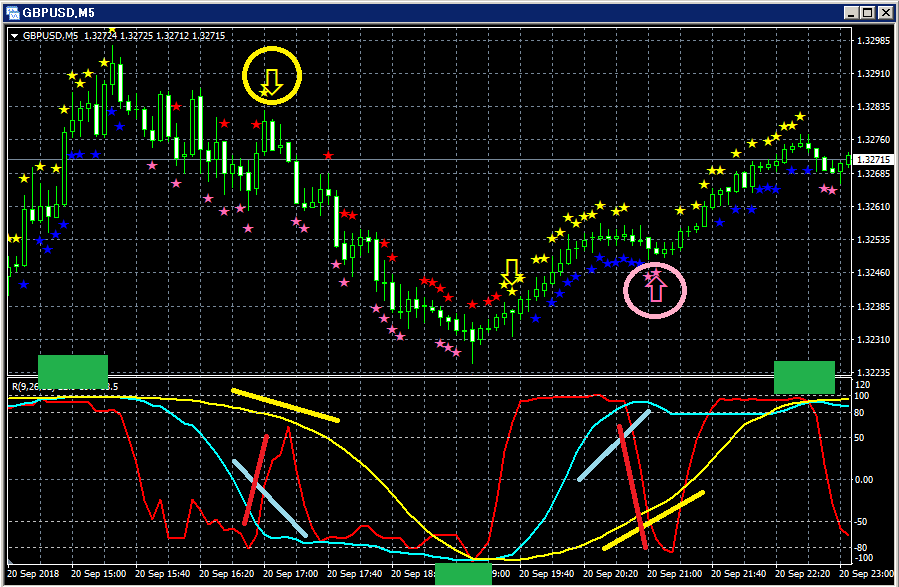
Top row:BODSOR
Bottom row: RCI3 lines (red: RCI9, light blue: RCI26, yellow: RCI52)
1.Rci3 triple top rises
2.From the RCI3 triple top, the short-term line RCI9 temporarily falls and then retraces
“RCI3 Lines + BODSOR” pullback selling signal lights up.
3.RCI3 triple bottom falls
4.From the RCI3 triple bottom, the short-term line RCI9 temporarily rises and then pullback
“RCI3 Lines + BODSOR” pullback buying signal lights up.
5.Rci3 triple top rises.
(1) Pullback buy signal (pink circle around)
Among the RCI3 lines, only RCI9 is clearly declining.
If RCI9 reverses and starts rising, all three RCI lines may rise together.
In other words, price may rise strongly.
Under such a circumstance,BODSOR pullback buy signal (pink arrow) lights up.
(2) Pullback sell signal (yellow circle)
Among the RCI3 lines, only RCI9 is clearly rising.
If RCI9 reverses and begins to fall, all three RCI lines may fall.
In other words, price may fall strongly.
Under such a circumstance,BODSOR pullback sell signal (yellow arrow) lights up.
An indicator developed to improve entry accuracy when using the RCI3 lines for pullback buying or pullback selling
.
Twitter
https://twitter.com/RCIX3Line
Blog
http://bodsor.blog.fc2.com/
Investment Navigator+
https://fx-on.com/navi/serial/?id=359
YouTube
https://www.youtube.com/channel/UCL-g5uAlesiWVJEDtWlFvGw
Example of pullback buying and pullback selling signals on USD/JPY 1-hour chart
Note: In the charts in this article, for convenience of explanation, circles, lines, and squares may be drawn, etc.,
so please understand.


