

Identify a trend reversal with "RCI3 Three-Line+BODSOR"!
BODSOR: An indicator developed to improve entry precision when buying on dips or selling on rallies using a three-line RCI
Examples of using RCI3-line and BODSOR
The figure below is a 5-minute chart of EURJPY.
EURJPY 5-minute chart (September 18, 2018)
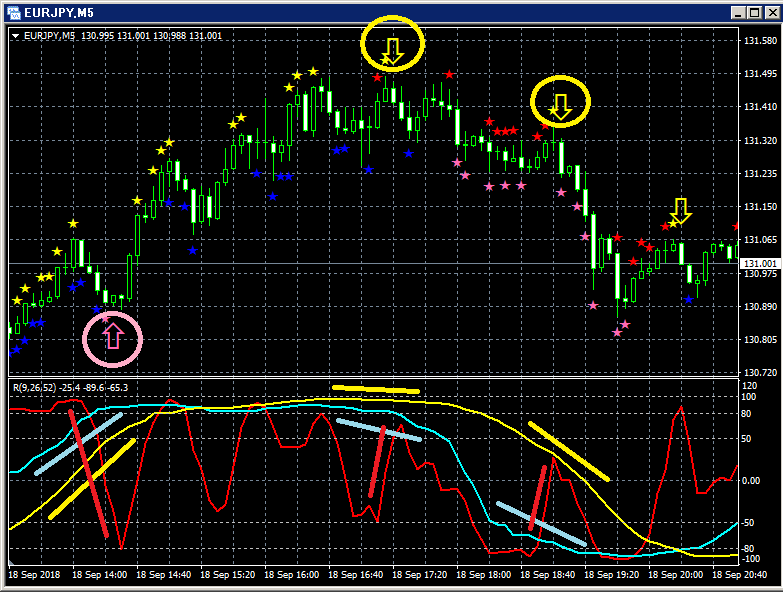
Upper section:BODSOR
Lower section: RCI3-line (red: RCI9, light blue: RCI26, yellow: RCI52)
(1) Buy on dip signal (pink arrow encircled)
Among the three RCI lines, only RCI9 is clearly trending downward.
If RCI9 reverses upward, all three RCI lines may rise together.
In other words, the price may rise strongly.
In such a situationBODSOR's buy-on-dip signal (pink arrow) lights up.
(2) Sell on rally signal (yellow arrow encircled)
Among the three RCI lines, only RCI9 is clearly trending upward.
If RCI9 reverses downward, all three RCI lines may fall together.
In other words, the price may fall strongly.
In such a situationBODSOR's sell-on-rally signal (yellow arrow) lights up.
Using the RCI3-line to place buy-on-dip or sell-on-rally entries,
this indicator was developed to improve entry accuracy
Twitter
https://twitter.com/RCIX3Line
Blog
http://bodsor.blog.fc2.com/
Investment Navi+
https://fx-on.com/navi/serial/?id=359
YouTube
https://www.youtube.com/channel/UCL-g5uAlesiWVJEDtWlFvGw
Examples of buy-on-dip and sell-on-rally signals on USD/JPY 1-hour chart
Note: In charts within this article, for ease of explanation, circles, lines, and shapes such as arrows may be drawn.
Please understand this.


