

【RCI3 single line + BODSOR】Dollar/Yen 15-minute chart Retrace sell signal 20180830
The original article ishere.
※BODSOR is an indicator developed to improve the entry accuracy when using the RCI three-line for buying on pullbacks or selling on rallies.
to enhance entry accuracy.
RCI Three-LineandBODSORUsage examples
One of the features of the RCI three-line (RCI9, RCI26, RCI52) is
“When all three RCIs point in the same direction, price movement in that direction tends to be larger.”
This is one of the characteristics.
If RCI26 and RCI52 are rising (falling) and RCI9 is falling (rising),
when RCI9 reverses“the three RCIs align in the same direction”is achieved.
Therefore, detecting when RCI9 reverses is extremely important.
(Case by case, but simply waiting for a confirmed reversal of RCI9 often leads to a late entry.)
Thus, BODSOR was developed to detect as early as possible the timing when the momentum of RCI9 to rise (or fall) weakens.
.
The figure below is yesterday’s (Thursday, August 30, 2018) USD/JPY 15-minute chart.
USD/JPY 15-minute chart, August 30, 2018 (Thu)
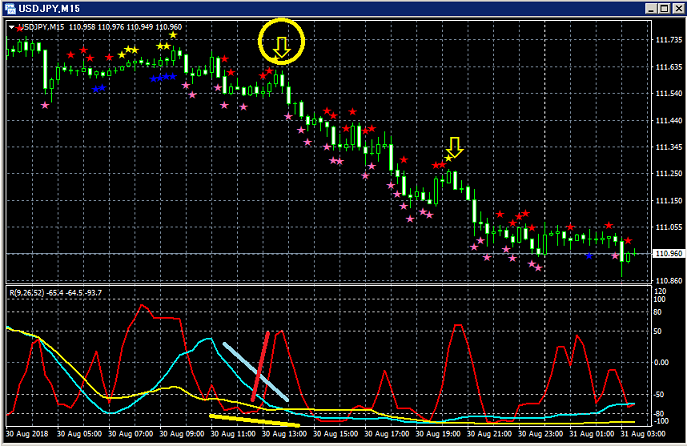
Top: BODSOR
Bottom: RCI Three-Lines (red: RCI9, light blue: RCI26, yellow: RCI52)
Among the three RCI lines, only RCI9 is clearly rising.
If RCI9 reverses downward, all three RCIs may align to decline.
In other words, price may fall strongly.
In such a situationBODSOR’s sell-on-rally signal (yellow arrows) lights up.
From right after the signal lights, the price clearly moves downward.
In this example, the candle two bars before the confirmed reversal of rising RCI9
is the moment the sell-on-rally signal is confirmed to light up.
.
Using the RCI three-line for buying on pullbacks or selling on rallies
to improve entry accuracy, this is an indicator developed for that purpose
Twitter
https://twitter.com/RCIX3Line
Blog
http://bodsor.blog.fc2.com/


