

【RCI3 One Line + BODSOR】USD/JPY 5-minute chart pullback buy signal 20180829
※BODSOR is an indicator developed to enhance the entry accuracy when buying on dips or selling on rallies using the RCI three-line.
RCI Three-Line and BODSOR practical applications
One of the features of the RCI three-line (RCI9, RCI26, RCI52) is
“When all three RCIs are aligned in the same direction, the price movement in that direction tends to be strong.”
This is the case.
When RCI26 and RCI52 are rising (or falling) and RCI9 is falling (rising),
if RCI9 reverses“All three RCIs align and point in the same direction”, that is the case.
Therefore, it is very important to anticipate when RCI9 will reverse.
(Case by case, simply waiting for the reversal of RCI9 to be confirmed often results in being late.)
Thus, BODSOR was developed to detect as early as possible the moment when the momentum of RCI9 to rise (or fall) weakens.
The figure below is yesterday’s USD/JPY 5-minute chart (Wednesday, August 29, 2018).
USD/JPY 5-minute chart August 29, 2018 (Wednesday)
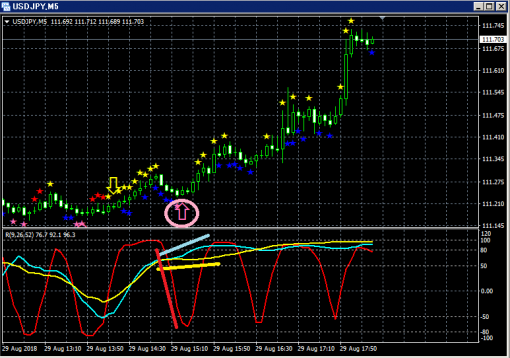
Top: BODSOR
Bottom: RCI Three-Line (Red: RCI9, Light Blue: RCI26, Yellow: RCI52)
Among the three RCI lines, only RCI9 is clearly declining.
If RCI9 reverses and rises, all three RCI lines may rise together.
In other words, there is a possibility of a strong price increase.
In such a situation,BODSOR’s dip-buying signal (pink arrow) lights up.
From immediately after the signal lights up, the price rises smoothly.
In this example, the candle three bars before the reversal of downward-moving RCI9 confirms the reversal rise,
and at the moment that candle closes, the dip-buying signal lights up and is confirmed.
An indicator developed to increase the entry accuracy when using the RCI Three-Line to make dip-buying or pullback selling decisions.

Twitter
https://twitter.com/RCIX3Line
Blog
http://bodsor.blog.fc2.com/


