

Pound-Dollar 1-Hour Chart Example of Reversal Sell Signal [RCI 3-Lines + BODSOR]
The figure below is the GBPUSD 1-hour chart.
GBPUSD 1-hour chart
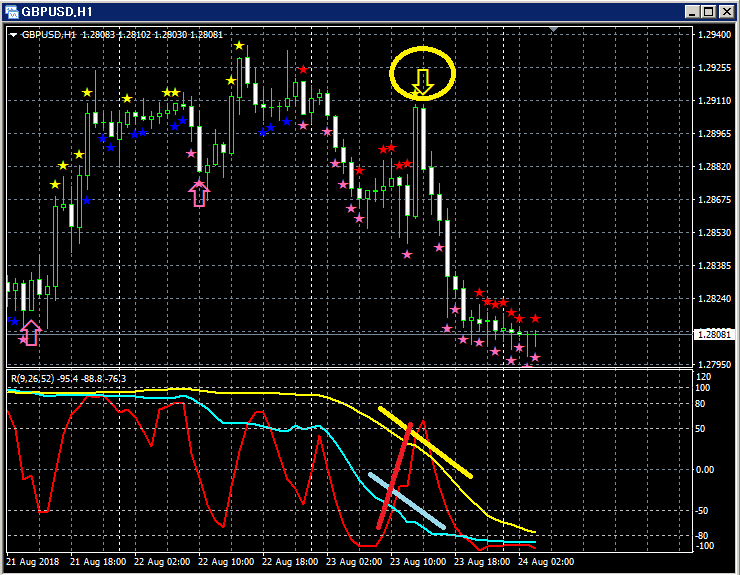
Top section:BODSOR
Bottom section: 3 RCI lines (red: RCI9, light blue: RCI26, yellow: RCI52)
Reversal selling signal (yellow arrows circled)
Among the 3 RCI lines, only RCI9 is clearly rising.
If RCI9 reverses and starts to fall, there is a possibility that all 3 RCIs will decline.
In other words, the price may also fall strongly.
In such a situation,BODSOR signals for reversal selling (yellow arrows) light up.
Immediately after the signal lights up, 6 consecutive bearish candles occur.
Note that the reversal of the rising RCI9 is confirmed after two bearish candles appear.
An indicator developed to improve the entry accuracy when using the 3 RCI lines for buying on dips or selling on rallies.
to enhance the precision.
Twitter
https://twitter.com/RCIX3Line
Blog
http://bodsor.blog.fc2.com/
Investment Navigator Plus
https://fx-on.com/navi/serial/?id=359
YouTube
https://www.youtube.com/channel/UCL-g5uAlesiWVJEDtWlFvGw
Example of pullback buying and reversal selling signals on USD/JPY 1-hour chart
※In the charts in this article, for convenience of explanation, circles, lines, squares, etc., may be drawn; please note this.
.


