

Dollar-Yen 10-minute chart Example of a short-term pullback sell signal [RCI 3 lines + BODSOR]
The figure below is the USD/JPY 10-minute chart.
USD/JPY 10-minute chart August 14, 2018
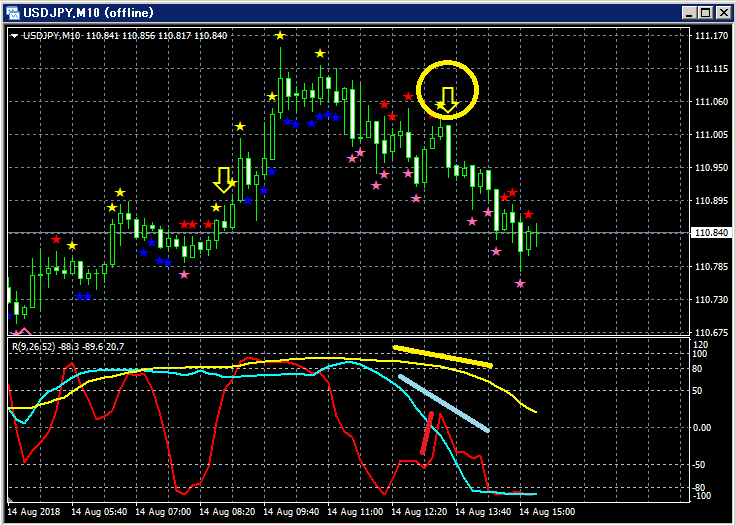
Top:BODSOR
Bottom: RCI three lines (red: RCI9, light blue: RCI26, yellow: RCI52)
Sell signal on a pullback (yellow arrows encircled)
Among the three RCI lines, only RCI9 is clearly rising.
If RCI9 reverses and falls, all three RCIs may decline together.
In other words, there is a possibility that price will fall strongly.
In such a situationBODSOR pullback sell signal (yellow arrows) lights up.
An indicator developed to enhance the accuracy of entries when using the three RCI lines for buying on dips or selling on rallies.

Twitter
https://twitter.com/RCIX3Line
Blog
http://bodsor.blog.fc2.com/
Investment Navi+
https://fx-on.com/navi/serial/?id=359
YouTube
https://www.youtube.com/channel/UCL-g5uAlesiWVJEDtWlFvGw
Example of pullback buy and sell signals on the 1-hour USD/JPY chart
※In the charts within this article, for convenience of explanation, yen marks, lines, and rectangles may be drawn,
so please understand.


