

Turkish Lira / Japanese Yen 4-hour Chart Example of Reversal Sell Signal [RCI 3 Lines + BODSOR]
The figure below is the USD/JPY 4-hour chart.
USD/JPY 4-hour chart
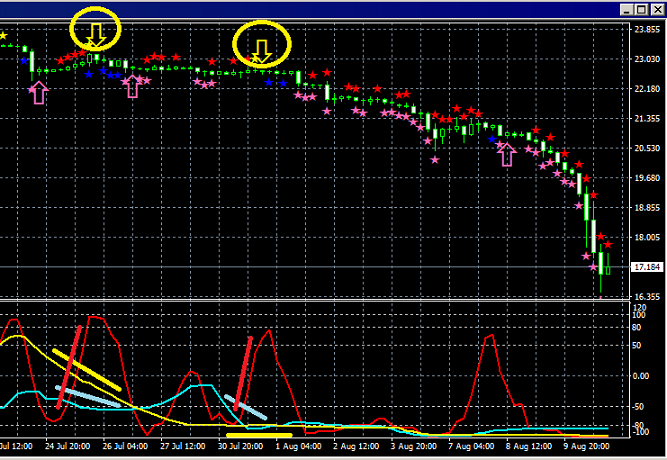
Upper panel:BODSOR
Lower panel: 3-line RCI (Red: RCI9, Light Blue: RCI26, Yellow: RCI52)
USD/JPY 4-hour chart (details when signal is on)
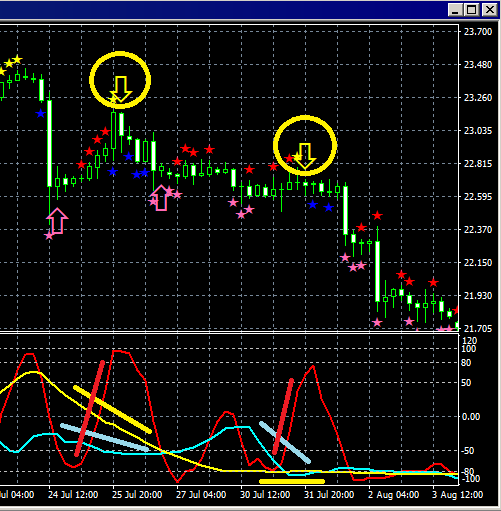
Upper panel:BODSOR
Lower panel: 3-line RCI (Red: RCI9, Light blue: RCI26, Yellow: RCI52)
Sell on bounce signal (yellow arrow circled)
Among the three RCI lines, only RCI9 is clearly rising.
If RCI9 reverses and falls, there is a possibility that all three RCIs will fall.
In other words, the price may also move strongly downward.
In such a situationBODSORs bounce-sell signal (yellow arrow) lights up.
An indicator developed to improve the entry accuracy when making pullback buys or bounce sells using the three-line RCI.

Twitter
https://twitter.com/RCIX3Line
Blog
http://bodsor.blog.fc2.com/
Investment Navi Plus
https://fx-on.com/navi/serial/?id=359
YouTube
https://www.youtube.com/channel/UCL-g5uAlesiWVJEDtWlFvGw
Example of pullback-buy and bounce-sell signals on the 1-hour chart of USD/JPY
Note: In the charts within this article, for convenience of explanation, there may be additions such as circles, lines, or boxes.
Please understand.


