

High-precision Reversal Sell Signal - USD/JPY - [RCI Three Lines + BODSOR]
The figure below is a USD/JPY 15-minute chart.
USD/JPY 15-minute chart
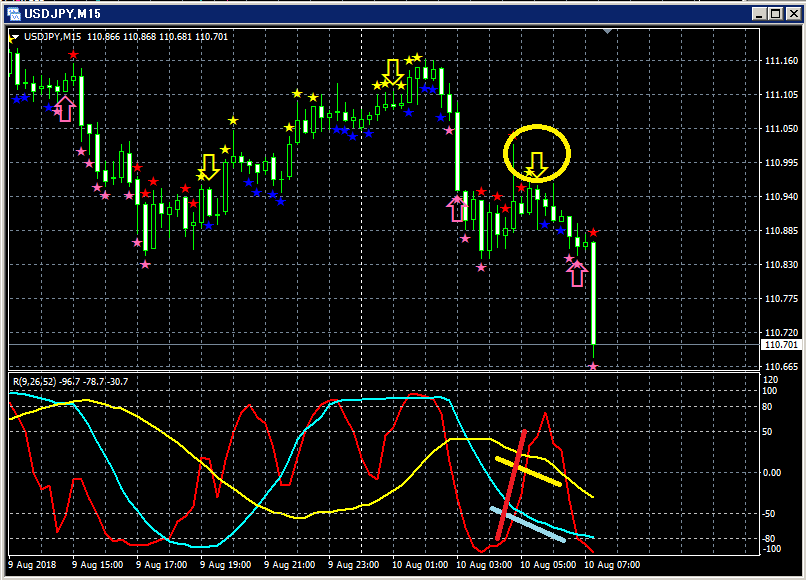
Upper row:BODSOR
Lower row: RCI three lines (red: RCI9, light blue: RCI26, yellow: RCI52)
Sell signal on the bounce (yellow arrows circled)
Among the three RCI lines, only RCI9 is clearly rising.
If RCI9 reverses and declines, all three RCI lines may align for a decline.
In other words, there is a possibility of a strong price decline.
In such a situationBODSORs bounce-sell signal (yellow arrows) lights up.
In the above example, after the signal occurred, three consecutive bearish candles appeared. Note that the decline in RCI9 is only confirmed after these three bearish candles appear.
Entry when using the three RCI lines for buying on dips or selling on rallies
to improve accuracy, this indicator was developed.
Twitter
https://twitter.com/RCIX3Line
Blog
http://bodsor.blog.fc2.com/
Investment Navi+
https://fx-on.com/navi/serial/?id=359
YouTube
https://www.youtube.com/channel/UCL-g5uAlesiWVJEDtWlFvGw
Examples of pullback buying and bounce selling signals on USD/JPY 1-hour chart
*In charts within this article, for convenience of explanation, you may see additions such as circles, lines, and rectangles drawn.
Please understand.


