

Example of a short-selling signal AUDJPY 1-hour chart [RCI3 lines + BODSOR]
The figure below is the AUDJPY 1-hour chart.
AUDJPY 1-hour chart
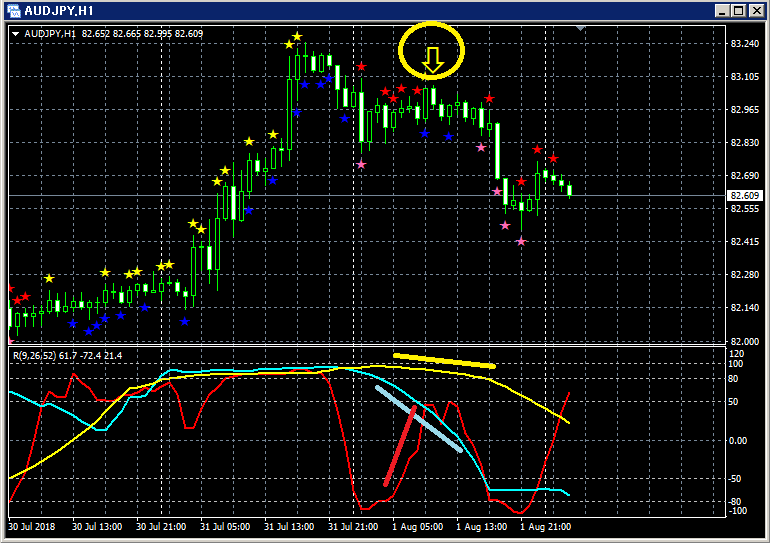
Upper section:BODSOR
Lower section: RCI three-line indicator (red: RCI9, light blue: RCI26, yellow: RCI52)
Buyback/Sell signal (yellow arrows circled in a circle)
Among the three RCI lines, only RCI9 is clearly rising.
If RCI9 reverses downward, there is a possibility that all three RCIs will move downward.
In other words, prices may also fall strongly.
In such a situation,BODSORbuyback/sell signal (yellow arrows) lights up.
Indicator showing breakout-buying/ retrace-sell signals【BODSOR】
Twitter
https://twitter.com/RCIX3Line
Blog
http://bodsor.blog.fc2.com/
Investment Navigation+
https://fx-on.com/navi/serial/?id=359
YouTube
https://www.youtube.com/channel/UCL-g5uAlesiWVJEDtWlFvGw
Example of a pullback-buying/ retrace-sell signal on the USD/JPY 1-hour chart
*In the charts in this article, for convenience, you may see additions such as circles, lines, and boxes drawn.
Thank you for your understanding.


