

Example of a selling signal in a downtrend Euro-Dollar 15-minute chart [RCI 3 lines + BODSOR]
The figure below is the 15-minute chart of EUR/USD.
EUR/USD 15-minute chart
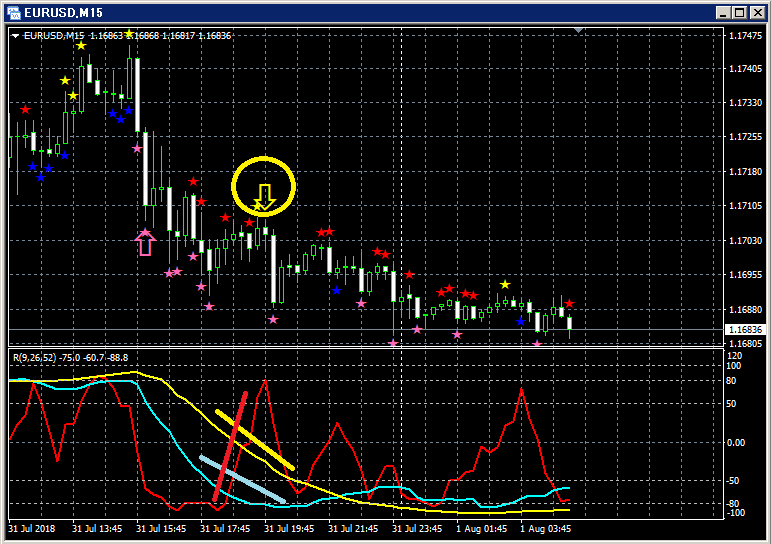
Upper section:BODSOR
Lower section: Three RCI lines (red: RCI9, light blue: RCI26, yellow: RCI52)
Sell on a pullback signal (yellow arrow encircled)
Among the three RCI lines, only RCI9 is clearly rising.
If RCI9 reverses and falls, there is a possibility that all three RCIs will decline.
In other words, price could also fall sharply.
In such a situation,BODSORpullback sell signal (yellow arrow) lights up.
Indicator that displays pullback buy and pullback sell signals [BODSOR]
Twitter
https://twitter.com/RCIX3Line
Blog
http://bodsor.blog.fc2.com/
Investment Navigator+
https://fx-on.com/navi/serial/?id=359
YouTube
https://www.youtube.com/channel/UCL-g5uAlesiWVJEDtWlFvGw
USD/JPY 1-hour chart: Example of pullback buy and pullback sell signals
*In the charts within this article, for convenience of explanation, you may see additions such as circles, lines, and rectangles drawn in.
Please understand.


